Repopulating units
I.A.1. Introduction
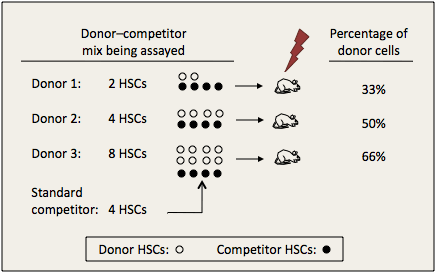
When we inject distinguishable cell mixtures into recipients and measure the percentage of differentiated cells produced by each type, differences in the raw percentage greatly underestimate the actual difference in numbers of stem cells. Figure I.1 below provides an example where all stem cells produce equal amounts of differentiated cells. Two, four, or eight stem cells (white circles) from donors 1, 2, or n, respectively, are mixed with a standard dose of 4 genetically marked competitor stem cells (black circles) and grafted into irradiated recipients. Recipients of 2 donor stem cells have 2/6 (33%) of differentiated cells from the donor type. Recipients of 4 donor stem cells have 4/8 (50%) donor type, and recipients of 8 donor stem cells have 8/12 (66%). Note that a doubling in number of donor stem cells, from 2 to 4, increases differentiated cells only 17%. A 4-fold (400%) increase in donor stem cells, from 2 to 8, increases differentiated cells only 33%.
Figure I.1. Changes in percentages of differentiated cells underestimate degrees of changes in stem cells.
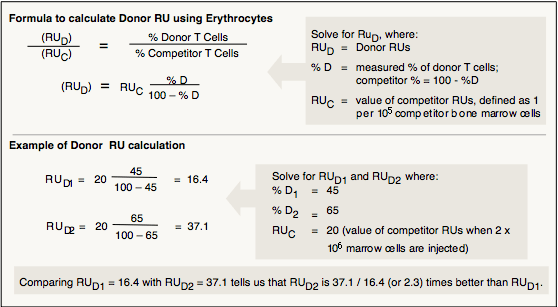
To accurately reflect the actual differences in functional activities relative to the function of the standard competitor, we have developed the concept of the repopulating unit (RU), where the number of donor RUs = the number of competitor RUs x (%Donor / 100 – %Donor). (Details are provided in Figure I.3, below.)
I.A.2. Terminology
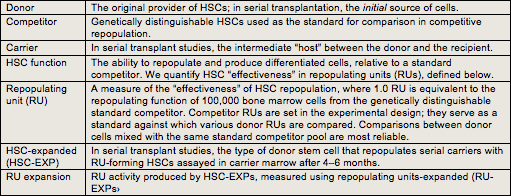
Table I.1 provides definitions of terms used throughout the discussion on our assays.
Table I.1. Terms and definitions related to our HSC assays.
I.A.3. Competitive repopulation assays
We measure HSCs using functional assays after bone marrow transplants. We inject a mixture of donor and competitor marrow, in which the original donor cells are distinguished from other cell types, such as the competitor and recipient, by genetic markers, such as ubiquitously expressed GPI isozyme differences. In the recipient, the HSCs produce erythrocytes, platelets, granulocytes, and monocytes/macrophages as well as lymphocytes (B cells and T cells). Figure I.2 is an overview of the HSC functional assay.
Figure I.2. The long-term competitive repopulation assay measures the ability to produce differentiated cells relative to the standard competitor.
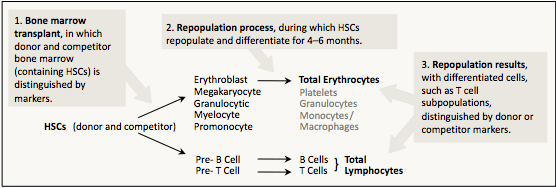
Because partially differentiated, yet multi-lineage, precursor cells continue to produce mature cells for up to 3 months, we compare percentages of differentiated cells descended from donor and competitor precursors 4–6 months after the transplantation. By this time, essentially all mature cells are descendants of the primitive HSCs (Jordan and Lemischka, 1990; Harrison and Zhong, 1992; Morrison and Weissman, 1994; Spangrude et al., 1995; Zhong et al., 1996). Although functional assays could be run on platelets, granulocytes or other myeloid cells, we usually use erythrocytes and lymphocytes.
I.A.4. Repopulating unit (RU) values
RU values measure donor HSC function relative to standard competitor HSCs. Figure I.3 illustrates how RU values are calculated.
Figure I.3. RU values are calculated from % donor-type cells in the recipients in competitive repopulation.
Fetal and adult (or adult and old) donors are used with the same genetically distinguishable competitor pool for each strain in each experiment, so that RU values are based on the same standard. HSC and HSC-EXP functions from each donor are evaluated using RU and RU expansion, respectively. To determine RU values, each of 4 lethally irradiated recipients receive a mixture of 1 million donor cells plus 1 million cells from the pool of standard genetically distinguishable competitor marrow. RU values are calculated from percentages of donor-type erythrocytes and lymphocytes in the recipients, where the relative repopulating abilities of 100,000 competitor marrow cells is defined as one RU. RU values at 4 weeks reflect short-lived precursors; RU values after 4–6 months reflect long-lived HSCs. In our studies, HSCs are quantified after 4 months. HSC-EXPs are quantified the same way, except the cells come from carriers rather than from the original donors.
I.A.5. Repopulating unit-expanded (RU-EXP) values
To determine RU expanded (RU-EXP) values, each of 2–3 lethally irradiated carriers receives 1 million donor marrow cells. After 4 months, BMCs are collected from healthy carriers and pooled for each donor. If desired, numbers of HSCs can be measured by antibody or dye exclusion markers in a portion of the marrow. Donor RU expansion in the carrier, i.e., total RUs per carrier per million donor cells, is quantified by RU-EXP values, as illustrated in Figure I.4.
Figure I.4. How HSC-EXP functions are estimated from RU-EXP values.
Long-term RU values are tested 4 months after transplantation of the mixture of 10 million carrier cells and one million standard competitor cells into each recipient. High doses of carrier marrow are needed, because after serial transplantation, BMCs repopulate far less effectively than cells transplanted directly from a donor (Harrison et al., 1990;Chen et al, 2000a; Yuan et al, 2005).
I.A.6. Advantages of RU and RU-EXP assays vs. other HSC assays
In vitro tests of HSCs may fail to predict actual long-term repopulating abilities and, especially, generation of HSCs. In contrast, HSC-EXPs, meaured as expansion of repopulating abilities in serial carriers, directly test long-term functional phenotypes. For example, "Long Term Colony-Initiating Cell" (LTC-IC) populations contain precursors capable of long-term repopulation in vivo (Cho and Müller-Sieburg, 2000), but LTC-IC precursor frequencies in vitro for C57BL/6J (B6) mice are consistently 5- to 10-fold less than for BALB/cByJ (BALB) or DBA/2J (D2) mice (Müller-Sieburg and Riblet, 1996;Chen et al., 2000b), as are cobblestone area-forming frequencies (de Haan et al., 2000). However, numbers of long-term functional HSCs are about 1 per 100,000 bone marrow cells (BMCs) in both BALB and B6 mice (Zhong et al., 1996; Chen et al., 1999). Most importantly, after serial transplantation of equal numbers of BMCs, those from young adult B6 donors produced RU-EXP values in carriers 2- to 3-fold greater than did BMCs from BALB or D2 donors (Chen et al., 2000a; Yuan et al., 2005). Thus, the strain pattern for RU expansion is the opposite of that for LTC-ICs. Because assays in vitro can give results opposite from long-term measures of repopulation in vivo, it is important to assay function in vivo, even when most work is in vitro, to be sure that the tissue culture results are relevant to results in the mice.