Competitive dilution assay
I.C.1. Introduction
In optimal doses for limiting dilution, about 37% of recipients have no HSCs (or whatever precursor is being tested) (Fazekas de St. Groth, 1982). For HSCs, this is about 30,000 marrow cells from young C57BL/6J (B6) mice (Zhong et al., 1996).
In competitive dilution, for each experiment, we calculate the fraction P0, which is the number of recipients or carriers with no donor cells / total number of recipients or carriers. The number of HSCs is n = -lnP0. To maintain health in the recipients, we mix 400,000 competitor marrow cells with each dose of 30,000 donor cells. Once the HSC number is calculated as above, it is of interest to ask how well the individual donor stem cells compete, by comparing the percentage of donor cells with the percentage of competitor cells. However, because both competitor and donor numbers are subject to Poisson statistics, the techniques below increase accuracy of estimates of function per stem cell. In some experiments, carriers receive an average of several donor cells, so that P0 is too low for accurate calculations. Fortunately, Poisson analyses can still estimate both stem cell number and function relative to the standard, based on the distribution of donor RU values in the recipients or carriers, as illustrated below.
I.C.2. Poisson model calculations
The Poisson formula (Snedecor and Cochran, 1980) is used to calculate the probabilities of given numbers of donor and competitor combinations in an injection dose. Probabilities are calculated for numbers of HSCs given to the carrier and for their ability to produce RUs, measured in carrier cells relative to the standard competitor dose. We combined these 2 sets of probabilities in a matrix for calculation of the probabilities of all possible combinations of these donor and competitor stem cells. Details are below, and the complete matrix and calculations are available on request to Dr. Harrison.
To calculate the expected donor percentage in recipients, we first test the hypothesis that each HSC contributes equally to the differentiated cell populations. Thus, the fraction of donor cells expected is the ratio of the number of expected donor HSCs to the number of total expected (donor + competitor) HSCs for each donor + competitor combination in the matrix (i.e., 1 donor and 2 competitors would give a donor percent of 1/3 or 33%). If calculated data do not fit actual data, we test the hypothesis that donor and competitor cells do not contribute equally. In this case, to calculate percentages, we add a factor "F," representing the difference between donor and competitor in repopulating ability per HSC. Next, the expected percentage of donor cells from the Poisson distribution is calculated as the ratio of the number of expected donor cells x F to the total expected (donor HSCs x F + competitor HSCs, where by definition, competitor F = 1).
The Poisson formula quantifies the probability "Pi" that a carrier is repopulated by any given number "i" HSCs as:
Pi = e-n(ni/i!), where "n" is the mean number of cells. Conditions required are as follows:
1) Cells are randomly distributed (met by mixing the marrow suspension used).
2) Each HSC has an equal opportunity to repopulate recipients (definition of the cell type).
As noted above, the Poisson formula is commonly used in "limiting dilution" to estimate frequency, by looking at the probability that i = 0, so that
P0 = e-n or n = -lnP0, where
P0 = number of carriers with 0% donor / total number of carriers getting the same cell dose.
I.C.3. Competitive dilution estimation of HSC number and function
When a given number of precursors is transplanted into each carrier, the probability Pi of having i cells in a particular carrier after an average of n cells are injected follows a Poisson distribution, calculated as Pi = e-n(ni/i!). For example, when an average of n = 1 donor cell is injected into each carrier, the probabilities (Pi) that a recipient will receive i = 0, 1, 2, 3, 4, 5 and 6 donor cells are given by the equation as 0.3679, 0.3679, 0.1839, 0.0613, 0.0153, 0.0031 and 0.0005 respectively.
When possible, cell numbers for the donor are estimated based on P0 (proportions of carriers that have 0% donor HSCs, thus showing no donor engraftment), so the Poisson equation reduces to
n = -ln (fraction of carriers with no donor RU in their marrow), as noted above.
To estimate functional ability per cell, we have constructed a spreadsheet that calculates probabilities for i = 0 to 15 for both donor and competitor using the N values calculated from P0 as described above. The probabilities of having different donor-competitor combinations form a 16 x 16 matrix of 256 combinational probabilities; each probability is associated with a donor-competitor HSC ratio. For each donor "D," we pick the number of highest combinational probabilities equal to the number of recipients, and use the associated donor-competitor HSC ratios to predict percentages of donor type blood cells. These models have been successful (Chen et al., 2000). A potential weakness is that they do not consider that several less likely combinational probabilities may give essentially the same prediction, and together result in a higher combinational probability that should be considered. Apparently, this weakness is not important enough to prevent our models from effectively representing real data (Zhong et al., 1996; Chen et al., 1999; Chen et al., 2000b).
At this point, hypotheses are tested about donor HSC functional ability per cell, "F," relative to that of competitor HSCs. Thus if F = 1, donor cells function equally as well as competitor cells. Each donor N and F combination produces a set of predicted values for the % donor type blood cells in the recipients. Each set of predictions is ranked and compared to ranked actual observations to calculate prediction–observation differences. The N and F values of the prediction set with the smallest total absolute prediction–observation difference are selected as the estimates of HSC concentration and HSC functional ability per cell for the donor under test.
I.C.4. Statistical analysis
For each Poisson estimation, each array of ranked predictions from the models is compared with actual observations in a paired t-test. Several models with hypothesized values of N and F are compared, and the selected model is significantly different from rejected models.
I.C.5. Interpretation of results
If concentrations of HSCs are not the same in tissues being compared, for example in B6 fetal liver and adult marrow, then functions must differ, because cell number x function per cell are equal.
I.C.6. Example: Poisson estimations of CXB-12 and CByB6F1 mice
This example tests HSC function. Figure I.6 presents results testing whether the increase in HSC function in CXB-12 mice, compared to BALB/cByxB6F1 (CByB6F1) mice, is in numbers of HSCs, function per HSC, or both. Each CByB6F1 recipient was given 5 x 10⁴ CXB-12 donor cells mixed with 5 x 10⁵ F1 competitor BMCs. After 6 months, 11 of the 37 recipients had 0% CXB-12 type (Gpi1a) blood cells. This gives the average HSC number as n = -ln (11/37), so N = 1.2 HSCs in 5 x 10⁴BMC, or 2.4 HSCs in 105 BMCs for CXB-12 mice.
To compare relative repopulating functions "F" of individual CXB-12 HSCs, we produced 3 sets of predictions. Of these, the assumption that F = 1.4 times the standard produced almost an exact fit of the real data (Figure I.6), and the differences between predicted and observed values for F = 1 or F = 2 were significantly higher than for F = 1.4. Thus, each CXB-12 HSC was 1.4 times as efficient as each F1 HSC in engrafting F1 recipients.
The predictions from models F = 1 and F = 2 were significantly different from actual observations; thus, models F = 1 and F = 2 were rejected. Predictions from model F = 1.4 were not significantly different from actual observations. Thus, F = 1.4 best represents the repopulating ability of a CXB-12 HSC relative to that of a CByB6F1 HSC (Chen et al., 2000b).
I.C.7. Example: Poisson estimations in C57BL/6J (B6) and BALB/cByJ (BALB) marrow and fetal liver.
Competitive dilution tests individual pre-hematpoeitic HSCs (PHSCs) in normal populations. This assay is important in testing PHSCs of hemoglobinopathies and GF-treated donors. Probabilities of various numbers of donor or competitor PHSCs at a given injection dose are calculated using the Poisson distribution. This calculation shows the random variation in actual numbers of PHSCs injected into each host. These results are combined to calculate probabilities of possible combinations of donor and competitor PHSCs. To calculate expected percentages of donor cells in each recipient, we model donor PHSC contributions to the differentiated cell populations, here assuming that donor cells contribute 1, 2, 3, or 4 times as well as competitor cells. Each calculated percentage is the ratio of the number of expected donor PHSCs to the total PHSCs expected (donor + competitor). For example, if they contribute equally, 1 donor PHSC + 2 competitor PHSCs give 33% donor type cells; this value increases to 67% if donor PHSCs contribute 4 times as well as competitor PHSCs. Numbers of most likely distributions in the model population are set equal to numbers of observations.
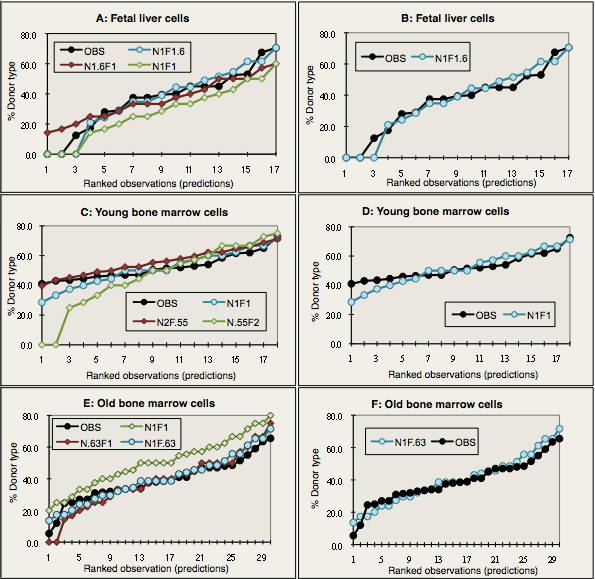
Genetic effects on individual PHSCs are shown by comparing C57BL/6J (B6) and BALB/cByJ (BALB). PHSCs from adult and fetal B6 mice repopulate equally, but PHSCs from fetal BALB mice repopulate better than those from adults.Percentages of donor type lymphocytes and erythrocytes were measured in blood samples 4 months after transplantation. These results were correlated, suggesting that they were descended proportionally from the same PHSC, so average values were used. Table I.4 shows that means and standard deviations of the observed and calculated best fit populations from Figure I.7 are nearly identical. Note that variances were similar (SD = 12–16) except for BALB fetal donors (SD = 26), due to fewer PHSCs with larger contributions.
Table I.4. Poisson model: average percentages of donor erythrocytes and lymphocytes
| Population | Observed mean ± SD (n) | Calculated best fit mean ± SD (n) |
|---|---|---|
| B6 marrow | 53 ± 12 (20) | 54 ± 14 (20) |
| B6 fetal liver | 56 ± 16 (19) | 54 ± 14 (19) |
| BALB marrow | 38 ± 13 (23) | 36 ±10 (23) |
| BALB fetal liver | 44 ± 26 (24) | 45 ± 24 (23) |
PHSCs contribute equally, with about 1 PHSC per 105 BMC. This is found for adult and fetal B6 and adult BALB cells (Figure I.7, panels A, B, D). BALB fetal cells give a different pattern (Figure I.7, Panel D). There is no bell-shaped curve, but a broad distribution including many recipients with no donor cells. This increased variability suggests fewer fetal precursors with higher contributions per PHSC. The best fit of calculated with observed data occurs if fetal PHSCs contribute 4 times as much as adult PHSCs.
I.C.8. Example: Poisson estimations in BALB/cByJ (BALB) from fetal to old HSCs
Competitive dilution can also measure individual PHSC clones in competition with standard doses of marrow, which compares relative repopulating abilities and maintains health in the recipients (Zhong et al., 1996). We directly measured long term repopulating abilities in limiting doses (0.25 to 1.0 x 10⁵) of genetically marked congenic marrow cells. These cells were mixed with a standard dose of 4 or 5 x10⁵ standard competitor BMCs. Percentages of donor type T and B lymphocytes, granulocytes, platelets, and erythrocytes were measured in recipient blood. Applying the maximum likelihood statistic, concentrations (per 105) of precursors repopulating at least 3 lineages were 2.3 and 3.4 after 6 weeks, 0.9 and 1.7 after 14–15 weeks, and 0.9 and 1.3 after 32 weeks.
At 6 weeks, similar levels of donor cells were produced in recipients of both short- and long-term precursors. However, after 14–32 weeks, contributions by short-term precursors—60 to 70% of precursors—dropped to zero, while contributions by long-term precursors—about one quarter of precursors—expanded several fold. The latter permanently repopulated all lineages after 30–32 weeks, functioning as PHSCs. Nearly all the variance in long-term repopulated recipients was explained using the Poisson distribution to calculate donor percentages, if each donor and competitor PHSC contributed equally.
We mixed BALB fetal liver, adult, or old marrow with BMCs from the same marked competitor pool and transplanted the mixture into irradiated BALB recipients. Results (modeled in Figure I.8), showed that BALB PHSCs lose functional ability, not number, during development to adulthood and as they age.
I.C.9. Numbers of recipients required
For each mixture of donor and competitor cells tested, numbers and function per stem cell are estimated by Poisson statistics. Because the key measure is variance, normal power analyses are not relevant (they give numbers needed to estimate means, not variances). Importantly, variance measures require the square of the number of repetitions (here, recipient mice) necessary to achieve satisfactory results with mean values (Dr. David Alling, NICHD senior statistician, personal communication). Thus, because 4–8 recipients or carriers prove adequate to distinguish mean differences in HSC or HSC-EXP function, 16–64 are needed to distinguish differences in variances. In practice, we find it best to use a minimum of 25 recipients. Even better results are obtained using 40 recipients.