Available data
We have published numerous data from our studies. However, much interesting and valuable data remains unpublished. In this section of our website, we are making some of this data available. Feel free to download and use this information. Please credit this website as the source of the data. Currently, not all information is available on our website. We will be adding more periodically. Information currently available is listed in normal type. Information not yet available is listed in italic type. Please direct any questions about data to Dr. David Harrison.
Treatment data
Activated lipid (HDL and LDL)
Table VI.9. C57BL/6J males and B6CBAT6F1 females: changes in weight among activated lipid fed, control, and colony control mice.
| C57BL/6J Males | ||||||||||
|---|---|---|---|---|---|---|---|---|---|---|
| Activated Lipid | Control | Colony Control | ||||||||
| Age | ||||||||||
| Group (days) | ||||||||||
| X | SE | N | X | SE | N | X | SE | N | ||
| 30 | Y | 22.1 | 0.3 | 36 | ||||||
| 60 | Y | 23.6 | 0.4 | 12 | 26.3 | 0.4 | 12 | |||
| 90 | Y | 27 | 0.5 | 12 | 27.8 | 0.3 | 12 | 29.2 | 0.4 | 36 |
| 164 | Y | 29.8 | 0.7 | 12 | 30.4 | 0.6 | 12 | |||
| 210 | Y | 32.7 | 0.9 | 12 | 33.5 | 0.8 | 12 | 33.4 | 2.2 | 36 |
| 860 | O | 34.6 | 0.5 | 14 | 37.8 | 1.1 | 12 | 30.4 | 0.6 | 30 |
| 910 | O | 36.4 | 0.6 | 13 | 37.5 | 1.2 | 10 | |||
| 963 | O | 31 | 1 | 10 | 33.1 | 0.9 | 4 | |||
| B6CBAT6F1 Females | ||||||||||
| 30 | Y | 15.8 | 0.3 | 24 | ||||||
| 60 | Y | 18.4 | 0.2 | 12 | 18.9 | 0.3 | 12 | |||
| 90 | Y | 20.9 | 0.4 | 12 | 22.7 | 0.5 | 12 | 24.7 | 0.5 | 24 |
| 164 | Y | 24.3 | 0.5 | 12 | 25.5 | 0.7 | 12 | |||
| 210 | Y | 25.3 | 0.6 | 12 | 28.4 | 0.7 | 12 | 27.2 | 0.5 | 24 |
| 860 | O | 39.1 | 1 | 16 | 35.3 | 1.7 | 12 | 34.2 | 0.7 | 34 |
| 910 | O | 38.9 | 1.4 | 13 | 34.6 | 1.1 | 11 | |||
| 963 | O | 34.6 | 2 | 8 | 29.9 | 1.3 | 9 | |||
| *- Young groups were fed activated lipid for 225 days and old groups were fed until death (at least 225 days) | ||||||||||
| The colony control is a larger group of mice which were weighed over several year and were treated similarly. | ||||||||||
Figure VI.6. B6CBAT6F1 females: life span curves for activated lipid fed and control mice
Figure VI.7. Young mice (30 to 210 days): weight comparisons among lipid fed, control, and colony control mice
Figure VI.8. Old mice (860 to 963 days): weight comparisons among lipid fed, control, and colony control mice
Table VI.10. Biomarker values for young and old treated mice compared to controls
| Young (129 DAYS) | Old (927 DAYS) | |||||||||||
|---|---|---|---|---|---|---|---|---|---|---|---|---|
| Activated Lipid | Controls | Activated Lipid | Controls | |||||||||
| TEST | MEAN | SE | N | MEAN | SE | N | MEAN | SE | N | MEAN | SE | N |
| PS | 123 | 4.5 | 12 | 118 | 4.8 | 12 | 104 | 3.5 | 12 | 112 | 6.4 | 11 |
| TW | 186 | 21 | 12 | 156 | 24 | 12 | 24 | 5 | 12 | 33 | 11 | 10 |
| OF | 124 | 10 | 12 | 128 | 9.3 | 12 | 87.1 | 6.8 | 12 | 89.8 | 6.9 | 10 |
| BOLI | 1.1 | 0.4 | 12 | 0.3 | 0.3 | 12 | 0.8 | 0.3 | 12 | 0.5 | 0.4 | 10 |
| BW | 27.6 | 0.4 | 12 | 28.1 | 0.3 | 12 | 36.4 | 0.6 | 12 | 37.5 | 1.2 | 10 |
| TL | 9.3 | 0.05 | 12 | 9.7 | 0.03 | 11 | 10.2 | 0.04 | 12 | 10.5 | 0.03 | 9 |
| HR | 94.7 | 3.2 | 12 | 63.6 | 10 | 12 | 28 | 6.3 | 12 | 27 | 8.2 | 7 |
| HCT | 51.4 | 0.6 | 12 | 51.7 | 0.3 | 12 | 37.5 | 0.8 | 12 | 37.7 | 1.4 | 9 |
| HB | 16.4 | 0.6 | 12 | 16.4 | 0.07 | 12 | 11.8 | 0.4 | 12 | 12 | 0.5 | 9 |
| TTC | 8.6 | 0.7 | 12 | 9.5 | 0.7 | 12 | 171 | 15 | 13 | 188.3 | 18 | 6 |
| WH | 16 | 1.9 | 12 | 18.9 | 2.7 | 12 | 29.4 | 3.9 | 12 | 42.5 | 7.2 | 4 |
| LS | 982 | 12 | 14 | 962 | 13.4 | 11 | ||||||
| Systems assayed: | ||||||||||||
|
Behavioral: PS=paw strength; TW=tight wire; OF=open field; BOLI=fecal boli deposited during test. Physiological: BW=body weight; TL=tail length; HR=hair regrowth rate; HCT=hematocrit; HB=hemoglobin; TTC=tail collagen denaturation rate; WH=wound healing rate; LS=life span. |
||||||||||||
Chromium picolinate
Figure VI.9. Life span curves: treated vs. controls
Figure VI.10. Food consumption: comparisons between treated mice and untreated controls
Figure VI.11. Weight: comparisons between treated mice and untreated controls
Figure VI.12. Tail length: comparisons between treated mice and untreated controls
Distilled water
Figure VI.13. C57BL/6J males and females: combined life spans of treated and untreated mice
Figure VI.14. C57BL/6J males and females: weight comparisons of treated and untreated mice
Figure VI.15. C57BL/6J males and females: tail length comparisons of treated and untreated mice
Exercise
Figure VI.16. Effects of voluntary wheel running on life span
Baseline life span data
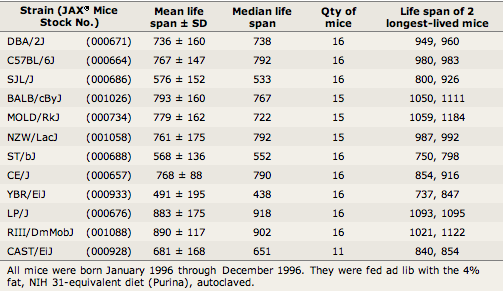
1We have had many requests for baseline life span statistics for various mouse strains. Following are life span data for standard inbred laboratory strains and for other strains we have studied in the Harrison Lab.
Commonly used JAX Mice and crosses (Study 1 and Study 2)
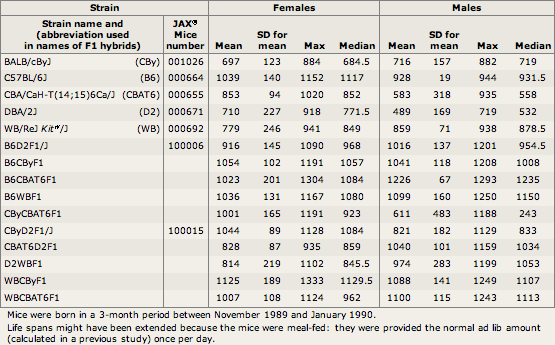
Historical life span summaries for commonly used strains of JAX Mice and F1 hybrids from some of these mice.
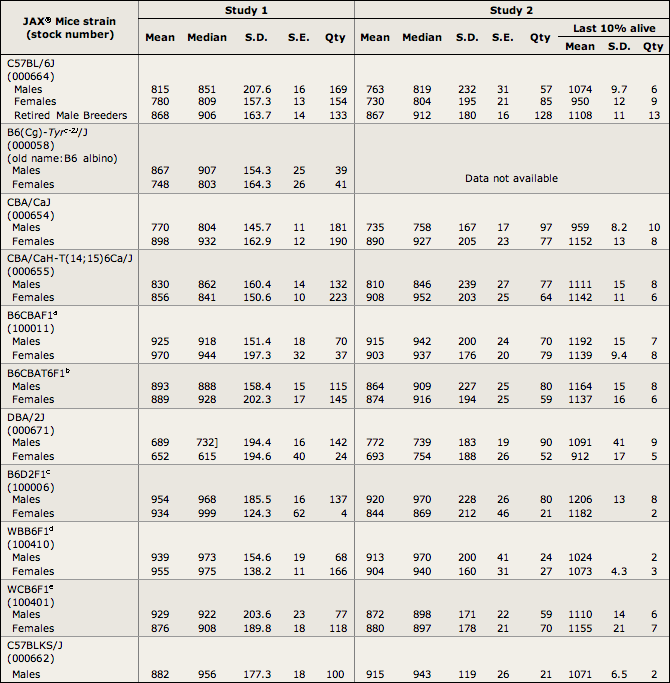
All mice were virgins, with the exception of C57BL/6J retired male breeders. All were fed The Jackson Laboratory,
6% fat, pasteurized diet (96WA; Emory Morse, Old Guilford, CT) ad lib.
Date range when mice were born: Study 1, 1976-1980; Study 2, (1981-1983).
aF1 hybrid of C57BL/6J female and CBA/CaJ male.
bF1 hybrid of C57BL/6J female and CBA/CaH-T(14;15)6Ca/J male.
cF1 hybrid of C57BL/6J female and DBA/2J male.
dF1 hybrid of WB/ReJ KitW/J female and C57BL/6J male. (Wild-type animals used for study.)
eF1 hybrid of WC/ReJ KitlSl/J female and C57BL/6J male. (Wild-type animals used for study.)
Twelve strains of commonly used laboratory mice (Study 2)
Survival curves for females of 12 inbred strains of laboratory mice. For comparison purposes, Panel A includes all 12 strains. For clarity, Panels B, C, and D include subsets of Panel A data. For tabular data, refer to Table VI.2, below.
Our diallele cross
Our 4-way crosses, selected for life span
| 1ML | |||||||||
|---|---|---|---|---|---|---|---|---|---|
| Females | |||||||||
| S0B | S1B | SIV | S2B | S3B | S4L | S5L | S6L | S7L | |
| Mean | 704.1 | 573.3 | 730.6 | 750.6 | 672.9 | 760.6 | 792.4 | 787.9 | 788.8 |
| Median | 738.0 | 595.0 | 732.0 | 806.5 | 711.0 | 744.5 | 810.0 | 857.0 | 835.0 |
| Stdev | 235.6 | 258.4 | 237.1 | 218.8 | 263.7 | 188.8 | 218.4 | 208.4 | 238.1 |
| Stderr | 35.1 | 48.0 | 27.7 | 47.8 | 56.2 | 32.9 | 44.6 | 47.8 | 54.6 |
| n | 46.0 | 30.0 | 74.0 | 22.0 | 23.0 | 34.0 | 25.0 | 19.0 | 19.0 |
| max 40% | 759-1164 | 667-1020 | 816-1214 | 838-1186 | 867-1028 | 801-1212 | 835-1122 | 900-1122 | 886-1172 |
| max 10% | 937-1164 | 906-1020 | 1059-1214 | 972 1186 | 994 1028 | 1113-1212 | 1074-1122 | 988-1122 | 1083-1172 |
| av>500d | 778.9 | 703.0 | 806.7 | 812.4 | 800.0 | 774.9 | 825.3 | 836.2 | 858.8 |
| 2ML | |||||||||
| FEMALES | |||||||||
| S0B | S1B | SIV | S2B | S3B | S4L | S5L | S6L | S7L | |
| Mean | 681.6 | 596.1 | 742.0 | 599.6 | 745.1 | 738.6 | 645.4 | 752.2 | 634.1 |
| Median | 675.5 | 599.0 | 777.0 | 632.0 | 778.5 | 726.0 | 668.0 | 760.5 | 582.5 |
| Stdev | 241.1 | 189.3 | 261.0 | 226.5 | 220.0 | 272.7 | 211.3 | 223.5 | 192.0 |
| Stderr | 36.8 | 42.3 | 29.4 | 50.7 | 50.5 | 39.4 | 51.6 | 50.0 | 40.9 |
| n | 44.0 | 21.0 | 80.0 | 21.0 | 20.0 | 49.0 | 26.0 | 20.0 | 22.0 |
| max 40% | 775-1322 | 669-1004 | 831-1203 | 693-1094 | 808-1127 | 816-1238 | 705-1052 | 827-1298 | 722-1012 |
| max 10% | 995-1322 | 854 1004 | 1078-1203 | 929 1094 | 1056 1127 | 1100-1238 | 953-1052 | 1021-1298 | 937-1012 |
| av >500d | 763.0 | 685.0 | 742.0 | 713.0 | 789.0 | 864.0 | 738.6 | 814.3 | 692.4 |
| 1ML | |||||||||
|---|---|---|---|---|---|---|---|---|---|
| MALES | |||||||||
| S0B | S1B | SIV | S2B | S3B | S4L | S5L | S6L | S7L | |
| Mean | 950.5 | 793.8 | 673.9 | 747.4 | 816.2 | 900.0 | 788.0 | 899.1 | 915.6 |
| Median | 979.5 | 893.0 | 699.0 | 772.5 | 825.5 | 960.0 | 833.0 | 870.5 | 933.0 |
| Stdev | 243.3 | 268.6 | 278.9 | 285.3 | 221.7 | 241.9 | 266.6 | 185.1 | 199.3 |
| Stderr | 36.3 | 51.7 | 32.0 | 62.3 | 46.2 | 40.3 | 53.3 | 40.4 | 45.7 |
| n | 46.0 | 28.0 | 77.0 | 22.0 | 24.0 | 37.0 | 26.0 | 21.0 | 19.0 |
| max 40% | 1026-1367 | 927-1139 | 808-1091 | 942-1052 | 916-1236 | 966-1248 | 863-1161 | 889-1231 | 935-1212 |
| max 10% | 1227-1367 | 1074-1139 | 974-1091 | 1045 1052 | 1224 1236 | 1160-1248 | 1148-1161 | 1230-1231 | 1143-1212 |
| av>500d | 967.2 | 891.4 | 799.2 | 856.6 | 874.1 | 933.3 | 874.8 | 899.1 | 915.6 |
| 2ML | |||||||||
| MALES | |||||||||
| S0B | S1B | SIV | S2B | S3B | S4L | S5L | S6L | S7L | |
| Mean | 912.1 | 851.1 | 767.9 | 763.6 | 756.3 | 951.5 | 876.6 | 927.5 | 944.0 |
| Median | 882.5 | 893.5 | 798.0 | 722.0 | 800.0 | 957.5 | 834.0 | 951.5 | 952.0 |
| Stdev | 247.6 | 228.6 | 270.2 | 247.7 | 252.2 | 248.4 | 266.9 | 142.6 | 147.3 |
| Stderr | 37.8 | 49.9 | 30.8 | 55.4 | 72.8 | 35.5 | 53.4 | 31.1 | 31.4 |
| n | 44.0 | 22.0 | 78.0 | 21.0 | 13.0 | 50.0 | 26.0 | 21.0 | 23.0 |
| max 40% | 999-1392 | 950-1270 | 840-1384 | 919-1317 | 938-1094 | 1055-1401 | 880-1403 | 995-1148 | 995-1203 |
| max 10% | 1261-1392 | 1139 1270 | 1080-1384 | 1063 1317 | 1094.0 | 1286-1401 | 1203-1403 | 1120-1148 | 1178-1203 |
| av >500d | 925.0 | 883.0 | 866.0 | 809.0 | 839.0 | 974.0 | 910.2 | 927.5 | 944.0 |
Figure VI.2. Mean life spans for 1ML and 2ML males and females.
Biomarker data
Table VI.5 provides 2 comparisons: 1) mice that were "Tested" vs. mice that were "Not tested"; 2) "Not tested" mice identified as moribund and necropsied vs. "Not necropsied" mice that were found dead and not necropsied. This second comparison indicates the accuracy of being able to identify old mice just before they die.
Table VI.5. Effects of biomarker testing on life span; the accuracy of identifying mice as moribund.
| SEX | MEDIAN | MEAN | SE | N | LAST 10% | |
|---|---|---|---|---|---|---|
| C57BL/6J | M | |||||
| Tested | 913 | 905 | 19 | 29 | 1031-1035 | |
| Not tested | 948 | 899 | 37 | 26 | 1112-1163 | |
| Not necropsied | 875 | 866 | 24 | 42 | 1082-1166 | |
| C57BL/6J | F | |||||
| Tested | 869 | 844 | 26 | 34 | 1013-1077 | |
| Not tested | 793 | 818 | 29 | 28 | 1048-1076 | |
| Not necropsied | 849 | 827 | 23 | 40 | 1026-1149 | |
| CBA/H-T6J | M | |||||
| Tested | 833 | 827 | 26 | 32 | 1023-1079 | |
| Not tested | 932 | 907 | 28 | 23 | 1092-1101 | |
| Not necropsied | 953 | 910 | 26 | 37 | 1119-1164 | |
| CBA/H-T6J | F | |||||
| Tested | 954 | 927 | 22 | 31 | 1070-1119 | |
| Not tested | 960 | 956 | 29 | 24 | 1160-1160 | |
| Not necropsied | 1002 | 989 | 31 | 38 | 1203-1275 | |
| B6CBAT6F1 | M | |||||
| Tested | 931 | 933 | 33 | 32 | 1179-1298 | |
| Not tested | 1063 | 1065 | 46 | 20 | 1283-1326 | |
| Not necropsied | 1009 | 997 | 30 | 41 | 1257-1309 | |
| B6CBAT6F1 | F | |||||
| Tested | 967 | 971 | 25 | 31 | 1139-1210 | |
| Not tested | 983 | 969 | 30 | 23 | 1163-1274 | |
| Not necropsied | 981 | 982 | 22 | 43 | 1177-1331 |
Mice in good health at 480 days of age, when study began. Tested = non-lethal biomarker test battery at 16 and 22 months of age; necropsied when moribund. Not tested = unused, but necropsied when moribund. Not necropsied = unused. Both practice and demonstrated expertise are required to recognize when mice are moribund.
Table VI.6. Effects of biomarker testing (at 495 and 675 days) on life spans of mice.
| STRAIN | SEX | MEAN | MEDIAN | STDEV | N | RANGE LAST 10% |
|---|---|---|---|---|---|---|
| C57BL/6J | M | 874.3 | 888 | 144.9 | 84 | 1045-1269 |
| F | 835.0 | 852 | 153.4 | 85 | 1019-1104 | |
| CBA/CAJ | M | 811.0 | 823 | 150.6 | 22 | 1014 |
| F | 917.5 | 911 | 145.6 | 22 | 1131-1139 | |
| CBA/H-T6J | M | 850.3 | 858 | 157.9 | 88 | 1060-1094 |
| F | 880.4 | 911 | 166.1 | 87 | 1067-1174 | |
| B6CBAF1 | M | 922.0 | 927 | 180.4 | 23 | 1192-1276 |
| F | 878.1 | 880 | 158.1 | 23 | 1127-1291 | |
| B6CBAT6F1 | M | 945.0 | 969.5 | 207.6 | 86 | 1195-1325 |
| F | 880.4 | 911 | 166.1 | 87 | 1069-1174 |
Table VI.7. Biomarker test results at 495 days.
| B6 Female | B6 Male | CBA Female | CBA Male | F1 Female | Male | |||||||||||||||||||
|---|---|---|---|---|---|---|---|---|---|---|---|---|---|---|---|---|---|---|---|---|---|---|---|---|
| Test | Mean | Stdev | n | var | Mean | Stdev | n | var | Mean | Stdev | n | var | Mean | Stdev | n | var | Mean | Stdev | n | var | Mean | Stdev | n | var |
| PS | 111.1 | 2.6 | 60 | 0.2 | 113.2 | 3.6 | 50 | 0.2 | 132.9 | 2.3 | 59 | 0.1 | 155 | 3.7 | 52 | 0.2 | 148 | 2.4 | 60 | 0.1 | 178 | 3.2 | 52 | 0.1 |
| TW | 84.9 | 8.1 | 71 | 0.8 | 82.9 | 8.9 | 62 | 0.9 | 174.4 | 7.2 | 72 | 0.4 | 109 | 7.4 | 65 | 0.6 | 205 | 7.3 | 72 | 0.3 | 131 | 9.7 | 62 | 0.6 |
| OF | 120.9 | 7.7 | 65 | 0.5 | 111.9 | 7.7 | 54 | 0.5 | 52.5 | 5.1 | 64 | 0.8 | 59.9 | 5.5 | 57 | 0.7 | 71.9 | 5.3 | 64 | 0.6 | 64.9 | 4 | 56 | 0.5 |
| BOLI | 1.4 | 0.2 | 65 | 1.4 | 0.83 | 0.2 | 54 | 1.6 | 7.3 | 0.3 | 64 | 0.4 | 5.4 | 0.3 | 57 | 0.4 | 4.8 | 0.3 | 64 | 0.5 | 3.7 | 0.3 | 56 | 0.6 |
| WGT | 28.9 | 0.5 | 72 | 0.2 | 33.9 | 3.3 | 62 | 0.8 | 31.7 | 0.4 | 72 | 0.1 | 37.2 | 0.4 | 65 | 0.1 | 31.3 | 0.5 | 72 | 0.1 | 40.1 | 0.5 | 64 | 0.1 |
| AST | 31.5 | 1.1 | 64 | 0.3 | 26.9 | 1.1 | 53 | 0.3 | 30.9 | 1.1 | 64 | 0.3 | 29.3 | 1.4 | 56 | 0.3 | 27.4 | 1.1 | 64 | 0.3 | 24.9 | 0.9 | 56 | 0.3 |
| TL | 10.1 | 0.1 | 29 | 0.1 | 10.4 | 0.1 | 27 | 0.1 | 10.3 | 0.1 | 28 | 0.1 | 10.6 | 0.1 | 29 | 0.1 | 10.4 | 0.1 | 28 | 0.1 | 10.9 | 0.1 | 28 | 0.1 |
| HR | 59.4 | 5.3 | 32 | 0.5 | 73.8 | 4.7 | 30 | 0.4 | 91.8 | 3.2 | 32 | 0.2 | 84.6 | 3.7 | 33 | 0.3 | 66.8 | 5.3 | 32 | 0.4 | 52.5 | 5.5 | 32 | 0.6 |
| HCT | 46.1 | 0.5 | 69 | 0.1 | 44.6 | 0.4 | 62 | 0.1 | 47.9 | 0.3 | 72 | 0.1 | 46.6 | 0.5 | 65 | 0.1 | 49.4 | 0.2 | 71 | 0.1 | 48.1 | 0.2 | 64 | 0.1 |
| HB | 14.8 | 0.2 | 67 | 0.1 | 14.3 | 0.2 | 58 | 0.1 | 15.8 | 0.2 | 68 | 0.1 | 15.1 | 0.2 | 61 | 0.1 | 16.2 | 0.1 | 68 | 0.1 | 15.9 | 0.2 | 60 | 0.1 |
| UC | 2553 | 73 | 56 | 0.2 | 2924 | 69 | 57 | 0.2 | 2623 | 62 | 59 | 0.2 | 2623 | 48 | 54 | 0.1 | 2830 | 81 | 58 | 0.2 | 3052 | 67 | 59 | 0.2 |
| TTC | 51.3 | 1.1 | 68 | 0.2 | 51.2 | 1.1 | 62 | 0.2 | 58.7 | 1.7 | 69 | 0.2 | 63.6 | 1.6 | 65 | 0.2 | 60.9 | 1.6 | 72 | 0.2 | 60.4 | 1.6 | 62 | 0.2 |
| WH | 22.2 | 0.8 | 46 | 0.2 | 18.6 | 0.8 | 41 | 0.3 | 24.7 | 1.4 | 49 | 0.4 | 25.9 | 1.1 | 45 | 0.3 | 16.2 | 0.5 | 52 | 0.2 | 15.4 | 0.4 | 42 | 0.2 |
PS=Paw Strength, TW=Tight Wire clinging time, OF=Open Field Activiy, BOLI=Fecal deposits during OF, WGT=Body Weight, AST=Avertin Sleeptime, TL=Tail Length, HR=Hair Regrowth after 25 days, HCT=Hematocrit, HB=Hemaglobin, UC=Urine Concentration Ability after 36 hours, TTC=Tail Tendon Collagen breaking tiime, WH=Wound Healing time after extraction of TTC.
Table VI.8. Biomarker test results at 675 days.
| B6 Female | B6 Male | CBA Female | CBA Male | F1 Female | F1 Male | |||||||||||||||||||
|---|---|---|---|---|---|---|---|---|---|---|---|---|---|---|---|---|---|---|---|---|---|---|---|---|
| Test | Mean | SD | n | var | Mean | SD | n | var | Mean | SD | n | var | Mean | SD | n | var | Mean | SD | n | var | Mean/th> | SD/th> | n/th> | var/th> |
| PS | 114.1 | 2.9 | 50 | 0.2 | 103.6 | 2.6 | 45 | 0.2 | 129.1 | 2.2 | 52 | 0.1 | 141 | 3.5 | 48 | 0.2 | 145 | 2.2 | 58 | 0.1 | 171 | 2.9 | 46 | 0.1 |
| TW | 56 .2 | 7.6 | 58 | 1.1 | 51.8 | 6.8 | 57 | 0.9 | 141.5 | 8.6 | 61 | 0.5 | 96.7 | 6.9 | 55 | 0.5 | 174 | 9.2 | 68 | 0.4 | 123 | 11 | 54 | 0.6 |
| OF | 109.3 | 6.3 | 57 | 0.4 | 97.7 | 7.3 | 57 | 0.6 | 60.4 | 5.9 | 59 | 0.8 | 65.1 | 8.5 | 54 | 0.9 | 56.8 | 4.7 | 68 | 0.7 | 57.3 | 5.7 | 54 | 0.7 |
| BOLI | 1.8 | 0.2 | 58 | 1.0 | 0.7 | 0.2 | 57 | 1.7 | 6.7 | 0.3 | 59 | 0.4 | 5.3 | 0.4 | 54 | 0.5 | 5.4 | 0.3 | 68 | 0.4 | 3.4 | 0.3 | 54 | 0.6 |
| WGT | 32.3 | 0.8 | 58 | 0.2 | 33.8 | 0.6 | 57 | 0.1 | 31.2 | 0.4 | 58 | 0.1 | 34.5 | 0.4 | 55 | 0.1 | 34.7 | 0.5 | 68 | 0.1 | 39.8 | 0.5 | 54 | 0.1 |
| AST | 31 | 1.1 | 57 | 0.3 | 29.7 | 1 | 54 | 0.2 | 26.2 | 1.1 | 59 | 0.3 | 24.7 | 1.3 | 51 | 0.4 | 27.1 | 0.8 | 67 | 0.3 | 26 | 1 | 54 | 0.3 |
| TL | 10 .1 | 0.1 | 23 | 0.1 | 10.5 | 0.1 | 29 | 0.1 | 10.3 | 0 | 27 | 0.1 | 10.6 | 0.1 | 27 | 0.1 | 10.5 | 0.1 | 28 | 0.1 | 10.9 | 0.1 | 25 | 0.1 |
| HR | 60.7 | 6.2 | 24 | 0.5 | 44.69 | 6.8 | 29 | 0.8 | 88.5 | 5.3 | 26 | 0.3 | 81.9 | 6.5 | 26 | 0.4 | 60.9 | 6.2 | 28 | 0.5 | 41.4 | 5.9 | 25 | 0.7 |
| HCT | 44.4 | 0.6 | 57 | 0.1 | 43.9 | 0.4 | 56 | 0.1 | 45.9 | 0.4 | 58 | 0.1 | 45.8 | 0.8 | 52 | 0.1 | 47.9 | 0.3 | 67 | 0.1 | 47.1 | 0.6 | 54 | 0.1 |
| HB | 13.8 | 0.3 | 55 | 0.1 | 13.8 | 0.2 | 53 | 0.1 | 14.95 | 0.2 | 54 | 0.1 | 14.6 | 0.3 | 48 | 0.1 | 15.5 | 0.2 | 63 | 0.1 | 15.2 | 0.2 | 50 | 0.1 |
| UC | 2321 | 67 | 41 | 0.2 | 2604 | 72 | 46 | 0.2 | 2644.2 | 62 | 47 | 0.2 | 2514 | 68 | 46 | 0.9 | 2820 | 68 | 50 | 0.2 | 2995 | 65 | 44 | 0.1 |
| TTC | 87.6 | 3.6 | 55 | 0.3 | 83.6 | 6.1 | 54 | 0.5 | 90.4 | 2.8 | 57 | 0.2 | 125 | 5.8 | 51 | 0.3 | 107 | 3.6 | 67 | 0.3 | 109 | 4.1 | 54 | 0.3 |
| WH | 21.6 | 0.8 | 41 | 0.2 | 23.9 | 1 | 36 | 0.2 | 26.95 | 1.7 | 40 | 0.4 | 29 | 1.7 | 36 | 0.4 | 16.5 | 0.6 | 51 | 0.2 | 17.5 | 0.6 | 38 | 0.2 |
Figure VI.3. Life spans of C57BL/6J males and females.
Figure VI.4. Life spans of CBA/CaH-T(14;15)6Ca/J males and females
Figure VI.5. Life spans of B6CBAT6F1 males and females