QTL mapping in the inbred mouse: the key to understanding complex traits in humans
JAX Notes | October 1, 2004
Quantitative trait locus (QTL) mapping locates and estimates the effect of genetic loci that regulate quantitative traits. These are traits that are complex, continuous and regulated by a group of genes interacting with each other and the environment. Using the inbred mouse as a model organism, QTL mapping has become a very important tool for finding the genes that regulate complex human diseases, including atherosclerosis, diabetes, obesity, asthma and hypertension. In the past two decades, QTL analyses have identified well over 2000 QTL associated with such diseases,1,2,3 and the genes underlying these QTL are being identified at a faster pace than ever. The increased role of QTL mapping and favored status of the inbred mouse in that role, are due to the improvement and development of genetic research tools (many of them pioneered by The Jackson Laboratory) to manipulate the mouse genome.
The inbred mouse is an ideal model organism for QTL mapping
Most QTL have been mapped in model organisms such as the mouse and the rat. QTL mapping in humans is difficult, time consuming, expensive, hampered by ethical problems and compromised by populations that are too small, too genetically diverse and subject to uncontrollable environments. Those obstacles are nearly all overcome in the laboratory mouse: the mouse room environment can be tightly controlled; laboratory mice are genetically well defined; mice can produce large populations quickly; the mouse genome can be manipulated in many ways; the laboratory mouse is relatively inexpensive to raise and maintain; QTL mapping projects in the mouse can take less than a year;4 and, most importantly, the biology of the mouse is very similar to ours.
That similarity has become all the more evident in the past 15 years as comparative genomics has demonstrated that the location of mouse and other model animal QTL can predict the location of homologous QTL in humans. This phenomenon was first revealed between laboratory rat and human hypertension QTL.5 Since then, it has been repeatedly substantiated and coined "concordance" 4 by Dr. Beverly Paigen of The Jackson Laboratory. She and co-researchers found significant concordance among mouse, human and rat hypertension QTL,4 between mouse and human HDL cholesterol QTL,6 between rat and human kidney disease QTL,7 between mouse and human atherosclerosis QTL,8 and among various species for osteoporosis, inflammatory bowel disease, type II diabetes and asthma QTL. It is thought that QTL genes are key regulators of interacting biochemical pathways,3,4 and thus may be potential targets for therapeutic intervention.
Because of cross-species concordance, QTL and their underlying candidate genes can first be identified, cost-effectively, in mice and then the genes can be tested relatively easily in humans and verified in mice.
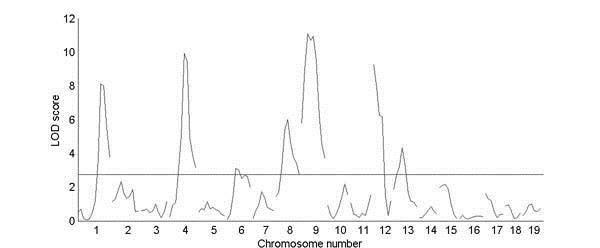
Genome scan for trabecular bone density, from a cross between strains C57BL/6J and C3H. The horizontal line above they axis represents a significant LOD score of 0.05 (as determined by permuting the trait values).
The number of resources for exploiting the inbred mouse are expanding
The genetic resources available for exploiting inbred mouse have increased tremendously in recent years: the mouse genome of several strains has been sequenced (JAX® Mice strain C57BL/6J was sequenced by the publicly-funded Mouse Genome Sequencing initiative, and JAX® Mice strains 129X1/SvJ, DBA/2J, and A/J were sequenced by Celera); many new polymorphic markers, including an increasingly large number of single nucleotide polymorphisms (SNPs), for the mouse genome are available; microarray technology and analysis is continually improving; new panels of consomic lines, tissue-specific transcripts, and proteome profiles are continually being developed.
In addition, powerful databases like the Mouse Genome Informatics (MGI) database, the JAX® Mice database and the Mouse Phenome Database – all maintained at The Jackson Laboratory – are constantly improving to facilitate QTL mapping in the mouse. The Mouse Phenome Database (MPD) is particularly useful for helping investigators select the most appropriate strains to cross in a QTL mapping project. The MPDt systematically characterizes biochemical and behavioral phenotypes of 40 commonly used and genetically diverse inbred mouse strains. It contains hundreds of measurements for phenotypes relevant to human health, including atherosclerosis, gallstones, alcoholism, hypertension, osteoporosis, airway hyperreactivity, pain responses, blood disorders, neurological disorders, behavioral and sensory disorders, and sensitivity to environmental pollutants. In addition, it is continually updated with data generated by contributing scientists.
SNP-genotyping greatly facilitates QTL mapping in inbred mice
Successfully mapping complex traits requires a densely spaced set of polymorphic markers and efficient methods of assaying them in the offspring of an experimental cross. In the early days, QTL mapping was based largely on restriction fragment length polymorphisms (RFLPs)10 . Later, they were based largely on microsatellite markers or single strand length polymorphisms (SSLPs).11 Currently, they are increasingly being based on single nucleotide polymorphisms (SNPs).
Dr. Petko Petkov and his colleagues at The Jackson Laboratory have tested and assembled a panel of 1,638 SNP markers that are informative and easily assayed in 103 mouse strains; including virtually all the most commonly used inbred and wild-derived inbred strains at The Jackson Laboratory. These SNP markers average about 1.6 Mb or 1cM apart and often represent the rare allele in at least two strains. All tests indicate that the SNP panel is a fast, reliable and cost-effective system for performing genome scans and QTL analyses.12 JAX® Services uses this panel to perform genome scans.
New statistical programs facilitate QTL mapping in inbred mice
The first statistical packages capable of QTL mapping were developed in the early 1990's.13 Since then, many new methods have been developed,14 including those by Jackson Laboratory scientists for identifying interacting QTL4 and for combining data from several crosses to more finely resolve QTL that have already been discovered.
The Jackson Laboratory has played a leading role in QTL mapping
We have over 85 years of experience in mouse biology, husbandry and genetics, and we have played a leading role in developing the genetic infrastructure of the laboratory mouse. Our scientists have performed scores of QTL crosses and genome scans, and they have identified many of the genes that underlie these QTL.
References:
1 Moore KJ, Nagle DL. 2000. Complex trait analysis in the mouse: The strengths, the limitations and the promise yet to come. Annu Rev Genet. 34:653-686.
2Mouse Genome Informatics (MGI) database.
3 Korstanje R, Paigen B. 2002. From QTL to gene: the harvest begins. Nat Genet. 31:235-6.
4 Sugiyama F, Churchill GA, Higgins DC, Johns C, Makaritsis KP, Gavras H, Paigen B. 2001. Concordance of murine quantitative trait loci for salt-induced hypertension with rat and human loci.Genomics 71:70-7.
5 Stoll M, Kwitek-Black A, Cowley AW Jr., Harris EL, Harrap SB, Krieger JE, Printz MP, Provoost AP, Sassard J, Jacob HJ. 2000. New Target Regions for Human Hypertension via Comparative Genomics. Genome Res. 10: 473-482.
6Wang X, Paigen B. 2002. Quantitative trait loci and candidate genes regulating HDL cholesterol: a murine chromosome map.Arterioscler Thromb Vasc Biol. 22:1390-401.
7 Korstanje R, DiPetrillo K. 2004. Unraveling the genetics of chronic kidney disease using animal models.Am J Physiol:Renal Physiol. 287: 347-352.
8DiPetrillo K, Tsaih SW, Sheehan S, Johns C, Kelmenson P, Gavras H, Churchill GA, Paigen B. 2004. Genetic analysis of blood pressure in C3H/HeJ and SWR/J mice.Physiol Genomics. 17:215-20.
10 Lander ES, Botstein D. 1989. Mapping mendelian factors underlying quantitative traits using RFLP linkage maps. Genetics 121:185-99.
11 Nadeau JH, Bedigian HG, Bouchard G, Denial T, Kosowsky M, Norberg R, Pugh S, Sargeant E, Turner R, Paigen B. 1992. Multilocus markers for mouse genome analysis: PCR amplification based on single primers of arbitrary nucleotide sequence.Mamm Genome 3:55-64.
12Petkov P, Ding Y, Cassell M, Zhang W, Wagner G, Sargent E, Asquith S, Crew V,Johnson K, Robinson P, Scott V, Wiles MV. 2004. An efficient SNP system for mouse genome scanning and elucidating strain relationships. (In press)
13 Manly KF, Olson JM. 1999. Overview of QTL mapping software and introduction to map manager QT. Mamm. Genome 10:327-34.
14 Sen S, Churchill GA. 2001. A statistical framework for quantitative trait mapping. Genetics 159: 371-387