When fed a western diet high in fat and cholesterol, mice with Apoe (B6.129P2-Apoetm1Unc/J, 002052) or Ldlr (B6.129S7-Ldlrtm1Her/J, 002207) mutations develop a spectrum of cardiovascular disease phenotypes that include:
Many of these phenotypes also develop when mice are fed a chow diet, although to a lesser extent (Figure 1, 2). The Mouse Phenome Database contains longitudinal data from this study, including body weights and clinical chemistry after 4, 8, and 12 weeks on diet. Additionally, MPD includes cardiac pathology images and chemistries at older ages (Jaxpheno10 dataset).
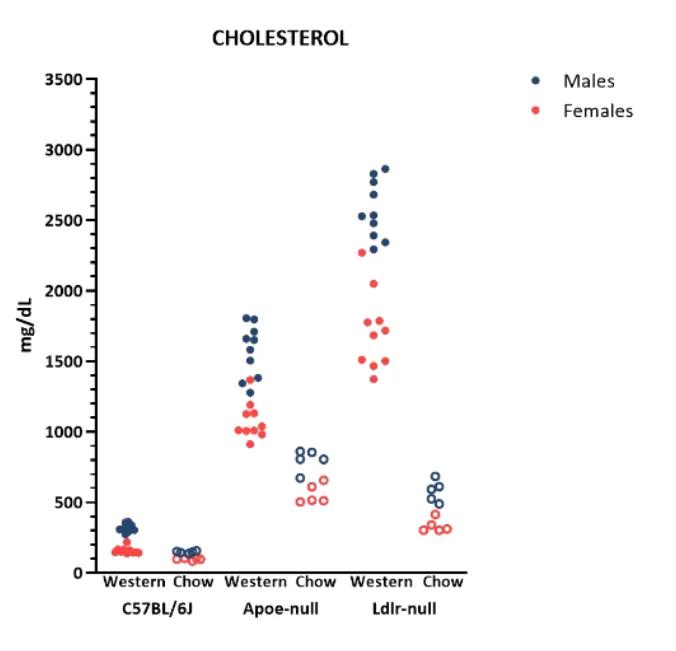
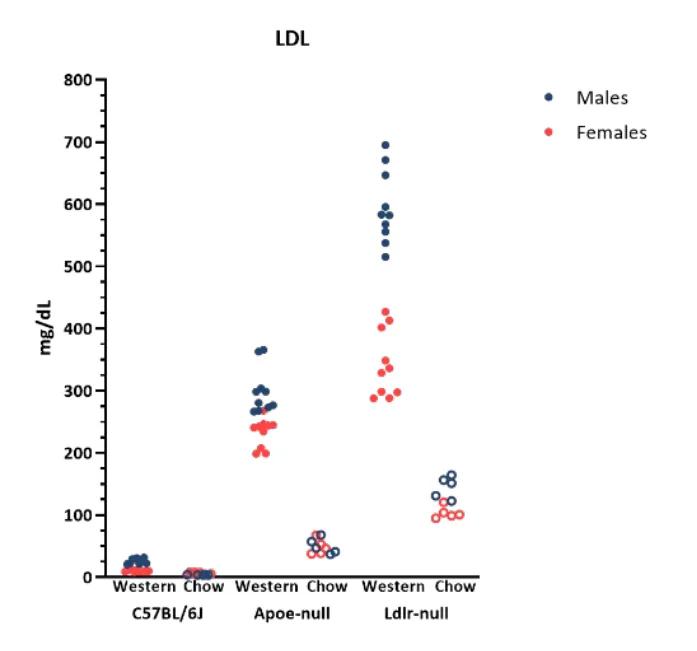
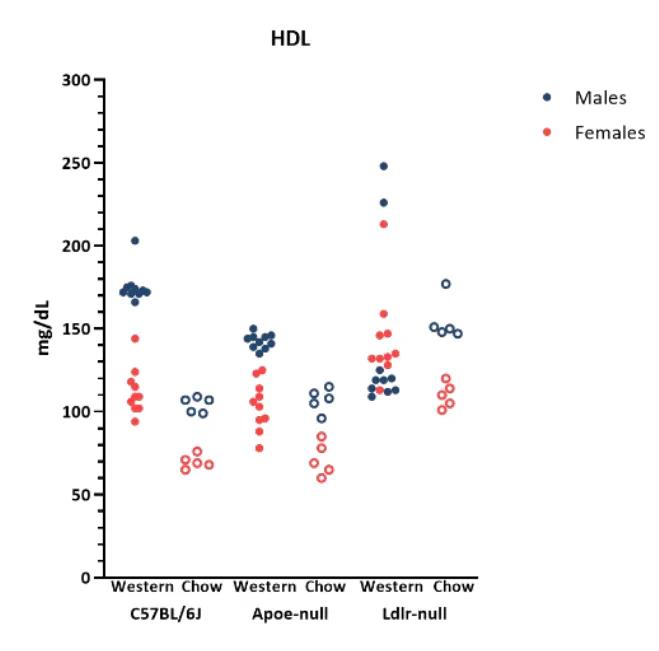

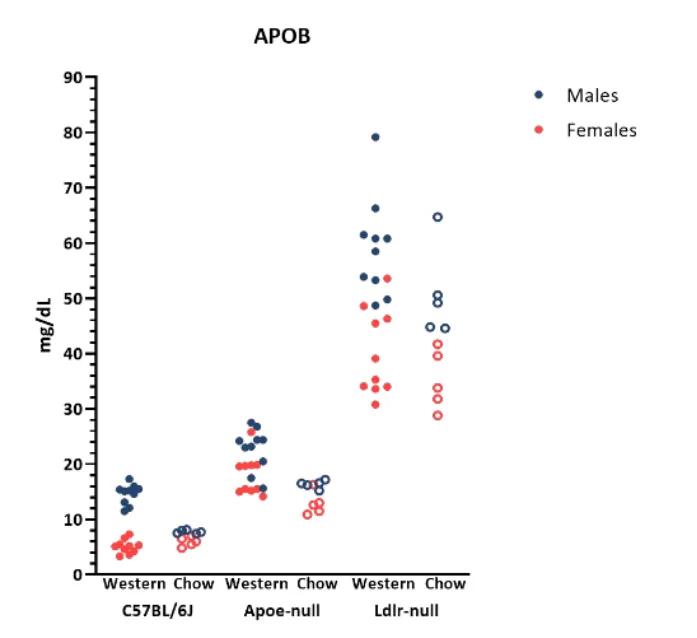

Figure 1 Dyslipidemia in Apoe and Ldlr knockout mice.
Starting at 6 weeks of age, western diet (Research Diets, Inc. D12079B) or chow diet (LabDiet® 5K52 formulation) was fed to Apoe & Ldlr knockout mice (10/sex) and C57BL/6J (5/sex). After 16 weeks on diet, serum was collected from submental blood and measured using a Beckman 700 AU chemistry analyzer.
Figure 2 Atherosclerosis after 16 weeks on diet.
Hearts were dissected, snap frozen, and cryosectioned with Oil Red O stain. Atherosclerosis was defined as intimal and medial accumulation of lipid, smooth muscle cells and inflammatory cells (macrophages) with or without reactive endothelial cells, fibrosis and chondroid metaplasia. Scores were assigned as follows: 0 = not present, 1 = focal small lesion, 2 = focal large lesion or multifocal small lesions, 3 = multiple large lesions protruding into the lumen, 4 = extensive confluent lesions. Sample sizes per sex & strain were 4 (western diet) or 2 (chow).
