NON/ShiLtJ males: a new model of diet-induced obesity and diabesity
JAX Notes | October 1, 2006Mouse models are extremely useful for researching obesity, diabetes, dyslipidemia and hypertension - the constellation of phenotypes associated with metabolic syndrome (Fong 2004; Isomaa et al. 2001). NON/ShiLtJ (NON,002423) mice (the name is derived from "Non-Obese Non-diabetic"), as the name suggests, generally do not become obese when fed a normal 6% fat diet and contain a diabetes resistant MHC haplotype (H2nb1 = Kb, Anb1, Ek, Db). However, they clearly harbor genes predisposing them to type 2 diabetes, as evidenced by early impaired glucose tolerance in males and females. In 2006, a study completed at The Jackson Laboratory, revealed that NON males fed a high-fat diet become obese and diabetic (chronically elevated non-fasting plasma glucose levels greater than 250mg/dl) and are a new model for researching diet-induced obesity (DIO) and obesity-induced diabetes (diabesity).
The study, led by Edward Leiter, Ph.D., and Stephen Linnell, compared the body weights, adiposity, multiple blood analytes, non-fasting plasma glucose levels and histology of relevant tissues in two groups of 10 NON males. In the first group, 4-week old males were fed a chow diet containing 10-11% fat by weight (TestDiet® 5K20) until they were 24 weeks old. In the second group, 4-week old males were fed the same diet for one week and then switched to a diet containing 24% fat by weight (Research Diets, Inc. D12451) until they were 24 weeks old. All mice were weighed weekly, their non-fasting plasma glucose levels measured (every four weeks for mice fed the high-fat diet; weeks 20 and 24 for mice fed the low-fat diet), and their body composition (bone and adipose tissue) determined by PIXImus DEXA (Dual Energy X-ray Absorptiometry). When the mice were 24 weeks old, samples of their blood and urine were collected; levels of several of their blood analytes (including plasma hormones and adipokines) determined; their pancreas, livers, and kidneys removed for histological analysis; and their brown adipose, inguinal, retroperitoneal and gonadal fat tissues removed and weighed.
From 6 through 24 weeks of age, NON males fed the 24% fat diet weighed significantly more than did the NON males fed a 10-11% fat diet (MANOVA,P<0.001; Fig. 1). Additionally, they became obese rapidly, weighing an average of 52 g by 17 weeks of age (17-week old C57BL/6J (B6) males from a separate study fed the same diet weighed an average of 35 g) (Fig. 1).
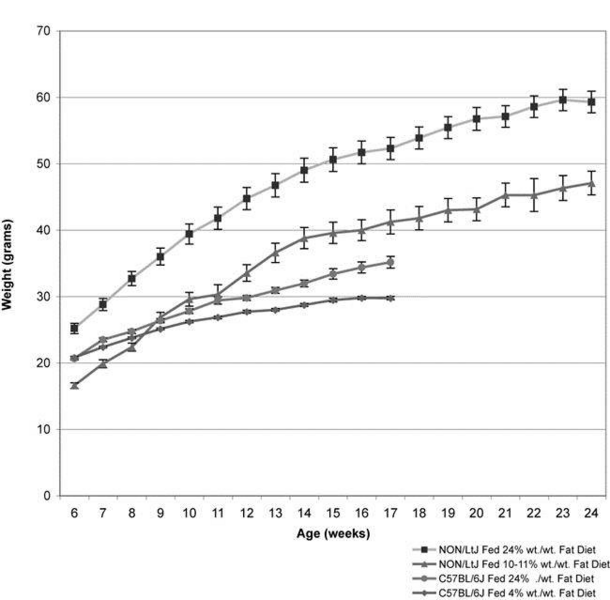
Figure 1. Comparison of mean (± s.e.m) weight gained among groups of NON and B6 males fed either a 10-11% or 24% diet.
NON males fed the 24% fat diet had significantly more inguinal fat, brown adipose tissue, and retroperitoneal fat (t-test, P<0.001, 0.02, and 0.001, and 0.001 respectively) but less gonadal fat (although not significantly so) than did those fed the 11% diet (Fig. 2).
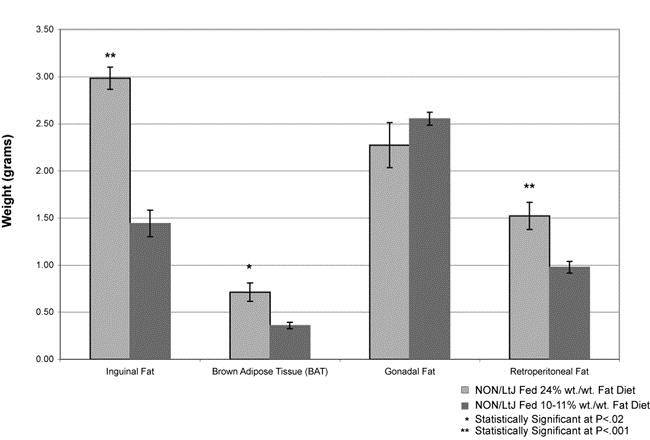
Figure 2. Comparison of mean (± s.e.m) weights of various fat deposits between NON males fed the 24% diet and those fed the 10-11% fat diet.
The mean fat mass and % fat of NON males fed the 24% diet were significantly greater than were those of males fed the 10-11% fat diet (t-test,P<0.001). The mean lean mass of mice fed either the 10-11% or 24% diets were comparable (Fig. 3).

Figure 3. Comparison of DEXA analysis of adiposity (mean ± s.e.m.) between NON males fed the 10-11% diet and those fed the 24% fat diet.
By 20 and 24 weeks of age, NON males fed the 24% fat diet had significantly higher glucose levels (t-test,P<0.03 and 0.001 respectively) than did males fed the 10-11% fat diet. Males fed the 24% fat diet developed a maturity-onset diabetes (B6 males fed the same diet did not) (Fig. 4).
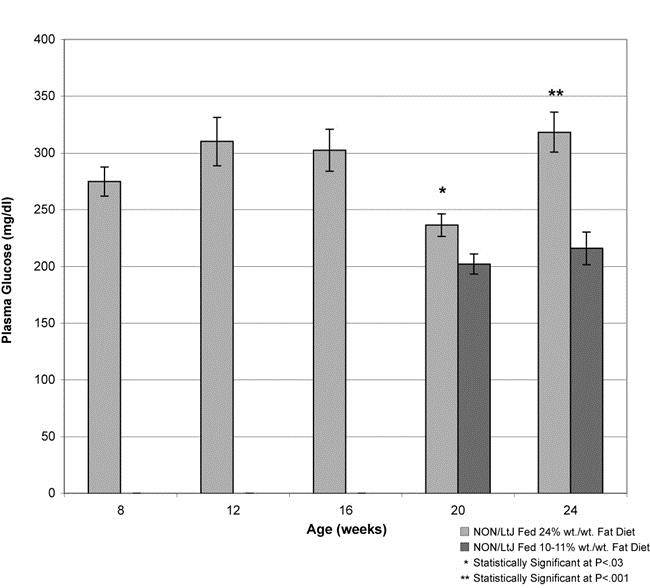
Figure 4. Mean glucose levels (± s.e.m) of NON males fed the 24% fat diet and those fed the 10-11% fat diet (levels determined every four weeks if mice fed the high fat diet; levels determined weeks 20 and 24 if mice fed the low fat diet).
By 24 weeks of age, NON males fed the 24% fat diet had approximately twice as much plasma insulin, leptin, and resistin as did those fed the 10-11% fat diet (t-test,P<0.001). In contrast, both groups of mice had comparable levels of adiponectin. Levels of PAI-1 (known as SERPINE1 in the mouse), a biomarker for hepatosteatosis, were nearly four times greater in mice fed the 24% fat diet (t-test,P<0.001; Table 1).
Diet | Insulin** | Leptin** | PAI-1** | Resistin** | Adiponctin |
|---|---|---|---|---|---|
10-11% fat (wt./wt.) | 1202 +/- 161 | 11867 +/- 1517 | 992 +/- 148 | 2415 +/- 275 | 3677 +/- 389 |
24% fat (wt./wt.) | 2827 +/- 475 | 25963 +/- 646 | 3828 +/- 574 | 4241 +/- 213 | 2994 +/- 190 |
Data are mean +/- SEM ** Difference statistically significant at P<.001 |
Table 1. Comparison of mean (± s.e.m.) levels of analytes (pg/ml) between 24-week old NON males fed the 10-11% and those fed the 24% fat diet.
Histological analysis revealed that pancreatic islets of all NON males (whether fed the 10-11% or 24% fat diet) were enlarged and had variable insulin granulation (detected by aldehyde fuchsin staining, Fig. 5A and B). The most notable difference between mice fed the 10-11% and those fed the 24% diet was the marked hepatosteatosis produced by the 24% fat diet (detected by PAS staining, Fig. 5C and D). Although some microvesicular fat accumulated in males fed the 10-11% fat diet, the accumulation was more widespread and associated with a loss of PAS-positive glycogen in the fat-filled hepatocytes of males fed the 24% fat diet. The kidneys of males fed the 24% fat diet showed more PAS-positive mesangial matrix staining than did those from males fed the 10-11% fat diet (Fig. 5E and F).
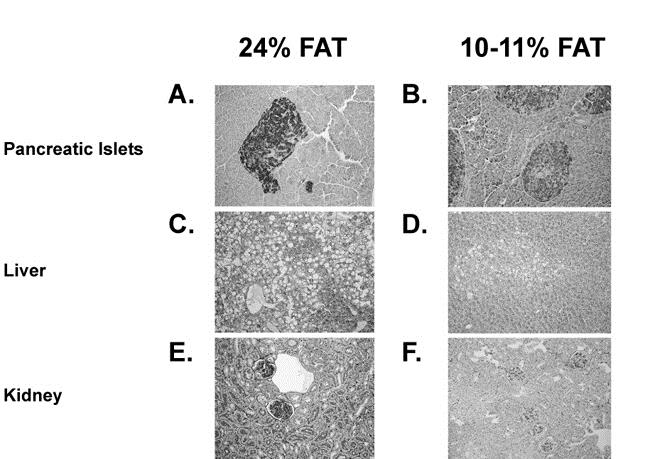
Figure 5. Histological comparison of pancreatic islets (A), liver (C), and kidney (E) tissue from 24-week old NON males fed the 24% fat diet and the same tissues (B, D, F respectively) from those fed the 10-11% fat diet).
In summary, NON males fed a high fat diet are a promising new model for diabesity, diet-induced obesity (DIO), and possibly other metabolic syndrome-associated disorders. The NON model differs from the more commonly used B6 DIO model in several ways. Although B6 males fed a high-fat diet become obese, hyperinsulinemic, insulin resistant, leptin resistant, hyperleptinemic, and develop impaired glucose tolerance (Collins et al. 2004; Petro et al. 2004; Rossmeisl et al. 2003; Van Heek et al. 1997; Surwit et al. 1995), they do not become diabetic. NON males fed a high-fat diet become obese more rapidly and gain more weight than B6 mice, and they do become diabetic. The NON mice also develop hepatosteatosis and kidney glomerular alterations, complications associated with human diabesity.
NON males fed a 45 kcal% fat diet are available by special arrangement via our JAX® Custom Diet Service.
References
Collins S, Martin TL, Surwit RS, Robidoux J. 2004. Genetic vulnerability to diet-induced obesity in the C57BL/6J mouse: physiological and molecular characteristics.Physiol Behav 81:243-8.
Fong TM. 2004. Targeting metabolic syndrome. Expert Opin Investig Drugs 13:1203-6.
Isomaa B, Almgren P, Tuomi T, Forsen B, Lahti K, Nissen M, Taskinen MR, Groop L. 2001. Cardiovascular morbidity and mortality associated with the metabolic syndrome.Diabetes Care 24:683-9.
Petro AE, Cotter J, Cooper DA, Peters JC, Surwit SJ, Surwit RS. 2004. Fat, carbohydrate, and calories in the development of diabetes and obesity in the C57BL/6J mouse.Metabolism 53:454-7.
Rossmeisl M, Rim JS, Koza RA, Kozak LP. 2003. Variation in type 2 diabetes--related traits in mouse strains susceptible to diet-induced obesity.Diabetes 52:1958-66.
Surwit RS, Feinglos MN, Rodin J, Sutherland A, Petro AE, Opara EC, Kuhn CM, Rebuffe-Scrive M. 1995. Differential effects of fat and sucrose on the development of obesity and diabetes in C57BL/6J and A/J mice.Metabolism 44:645-51.
Van Heek M, Compton DS, France CF, Tedesco RP, Fawzi AB, Graziano MP, Sybertz EJ, Strader CD, Davis HR Jr. 1997. Diet-induced obese mice develop peripheral, but not central, resistance to leptin.J Clin Invest 99:385-90.