Diet-induced obese (DIO) C57BL/6J mice do not develop overt type 2 diabetes, but they model early stages of the disease with phenotypes that include:
Diets were supplied by Research Diets, Inc.
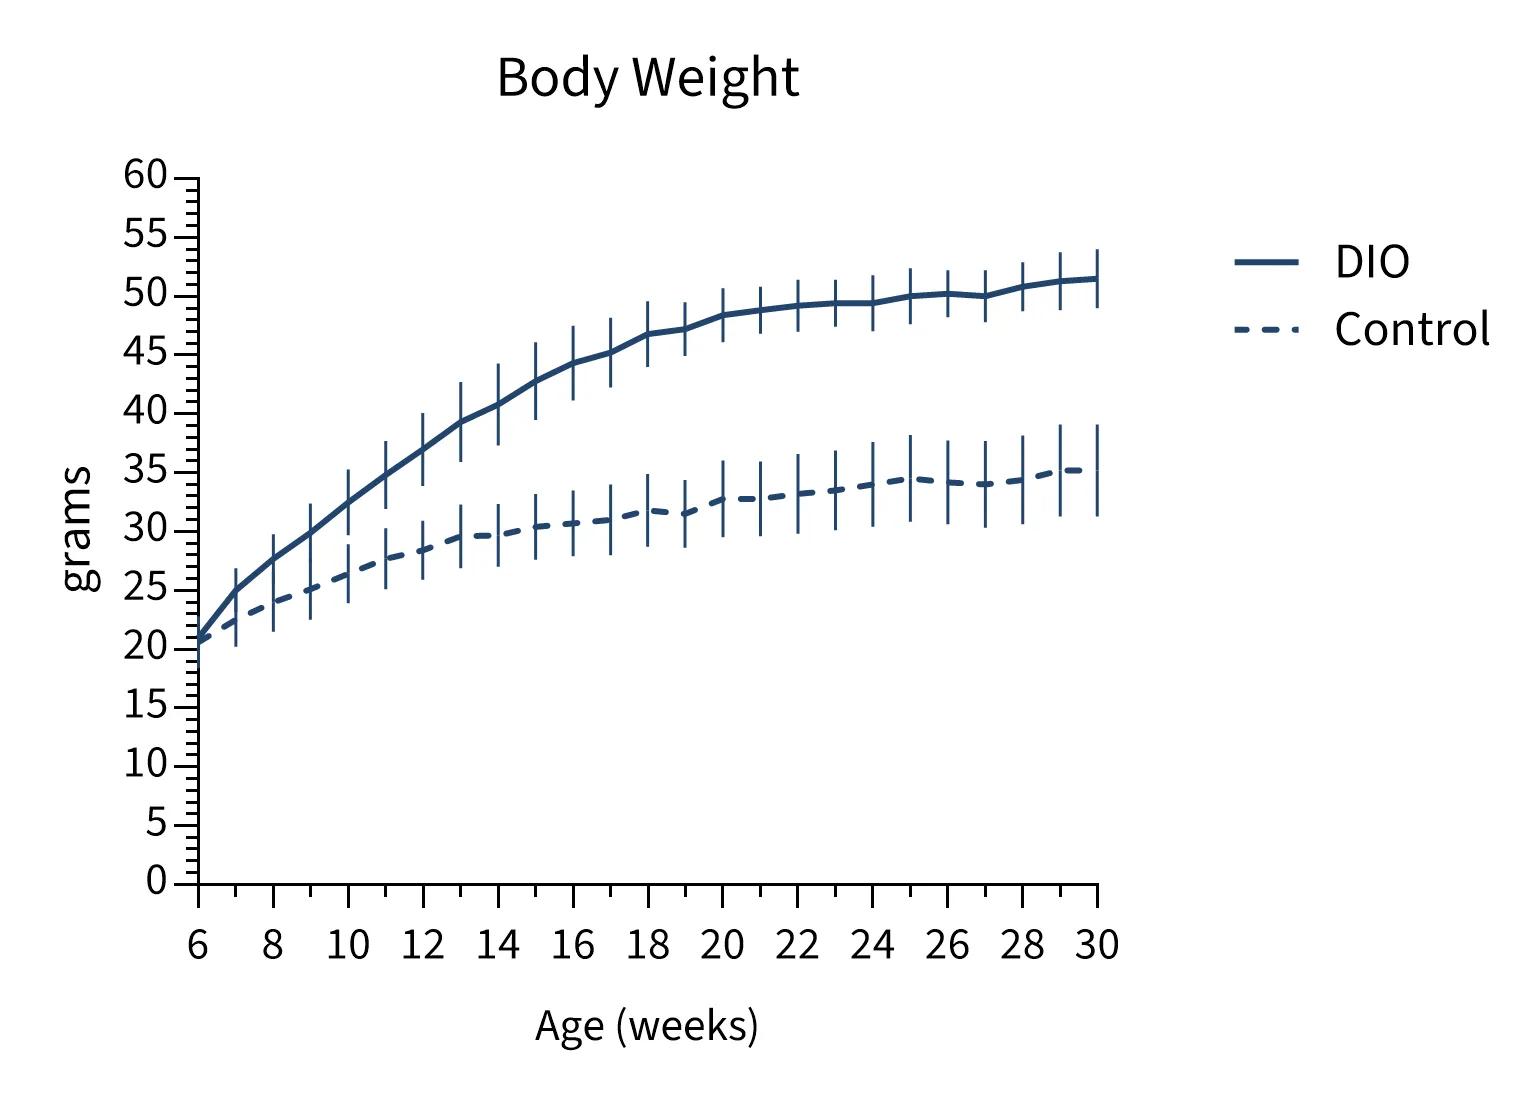
Figure 1 Body weight growth curve. Male C57BL/6J DIO mice were fed D12492 60 kcal% fat and Control mice were fed D12450B 10 kcal% fat diet between the ages of 6 and 30 weeks. Values represent mean and one standard deviation of at least 90 DIO and 60 Control mice per diet and age, measured longitudinally on the same day each week. When analyzed longitudinally using a repeated measures mixed-effects model with Sidak's multiple comparisons test, diet, age, and a diet x age interaction were each significant at P < 0.0001 (GraphPad Prism 10.5.0). All DIO vs Control weight differences were significant from the ages of 7 onward (P < 0.0001 for each). The average and standard deviation are shown for each age in the table below.
| grams (mean ± standard deviation) | |||||
|---|---|---|---|---|---|
| Age (weeks) | DIO | Control | Age (weeks) | DIO | Control |
| 6 | 21.0 ± 1.7 | 20.6 ± 2.2 | 19 | 47.2 ± 2.3 | 31.5 ± 2.9 |
| 7 | 25.0 ± 1.9 | 22.5 ± 2.3 | 20 | 48.4 ± 2.3 | 32.8 ± 3.3 |
| 8 | 27.7 ± 2.1 | 24.0 ± 2.5 | 21 | 48.8 ± 2.0 | 32.8 ± 3.2 |
| 9 | 29.9 ± 2.5 | 25.1 ± 2.6 | 22 | 49.2 ± 2.2 | 33.2 ± 3.4 |
| 10 | 32.5 ± 2.8 | 26.4 ± 2.5 | 23 | 49.4 ± 2.0 | 33.5 ± 3.4 |
| 11 | 34.8 ± 2.9 | 27.7 ± 2.6 | 24 | 49.4 ± 2.4 | 34.0 ± 3.6 |
| 12 | 37.0 ± 3.1 | 28.4 ± 2.5 | 25 | 50.0 ± 2.4 | 34.5 ± 3.7 |
| 13 | 39.3 ± 3.4 | 29.6 ± 2.7 | 26 | 50.2 ± 2.0 | 34.2 ± 3.6 |
| 14 | 40.8 ± 3.5 | 29.7 ± 2.7 | 27 | 50.0 ± 2.2 | 34.0 ± 3.7 |
| 15 | 42.8 ± 3.3 | 30.4 ± 2.8 | 28 | 50.8 ± 2.1 | 34.4 ± 3.8 |
| 16 | 44.3 ± 3.2 | 30.7 ± 2.8 | 29 | 51.3 ± 2.5 | 35.2 ± 3.9 |
| 17 | 45.2 ± 3.0 | 31.0 ± 3.0 | 30 | 51.5 ± 2.5 | 35.2 ± 3.9 |
| 18 | 46.8 ± 2.8 | 31.8 ± 3.1 | |||
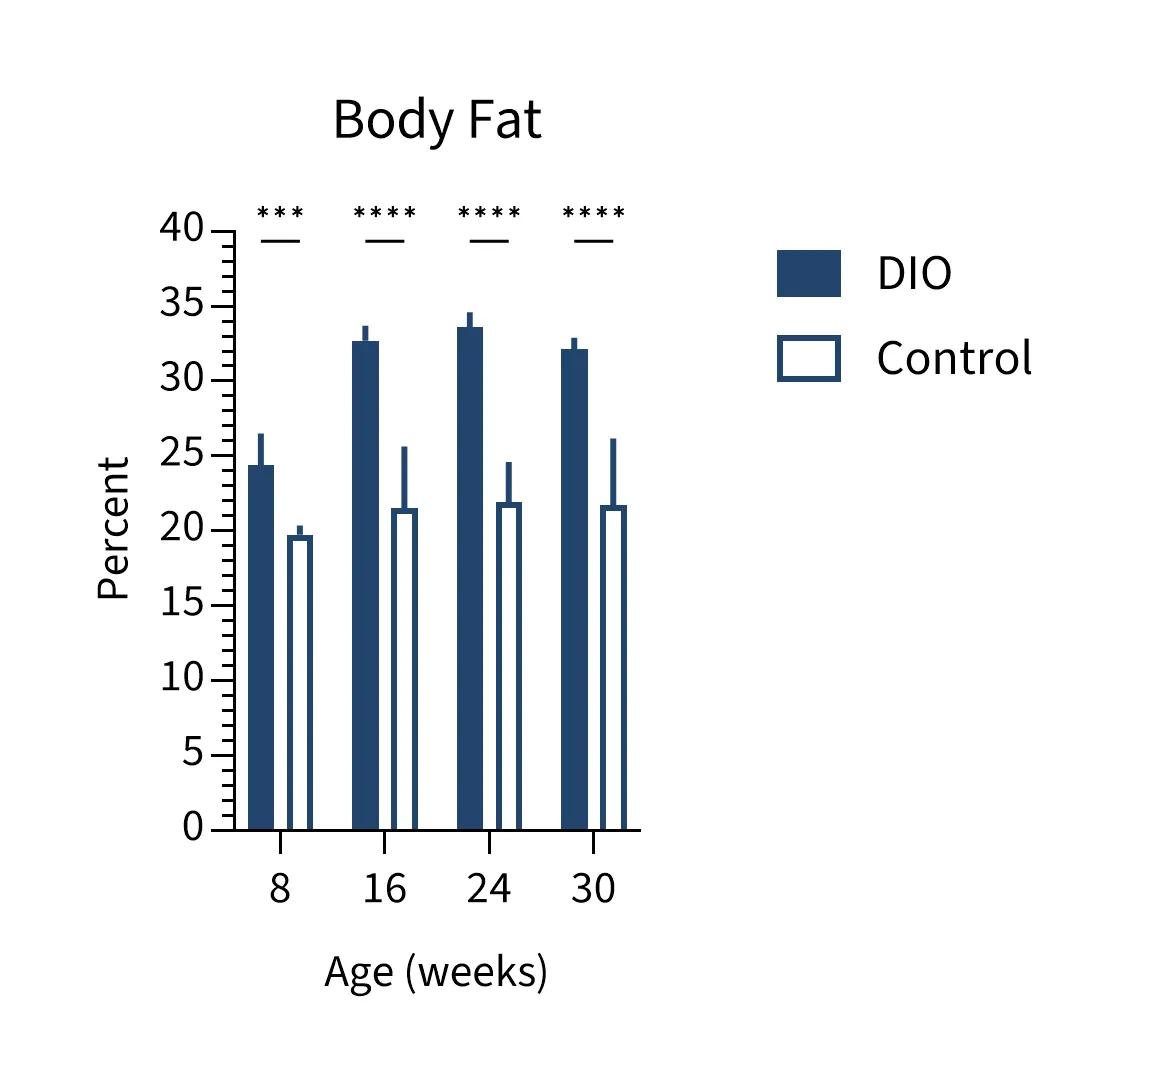
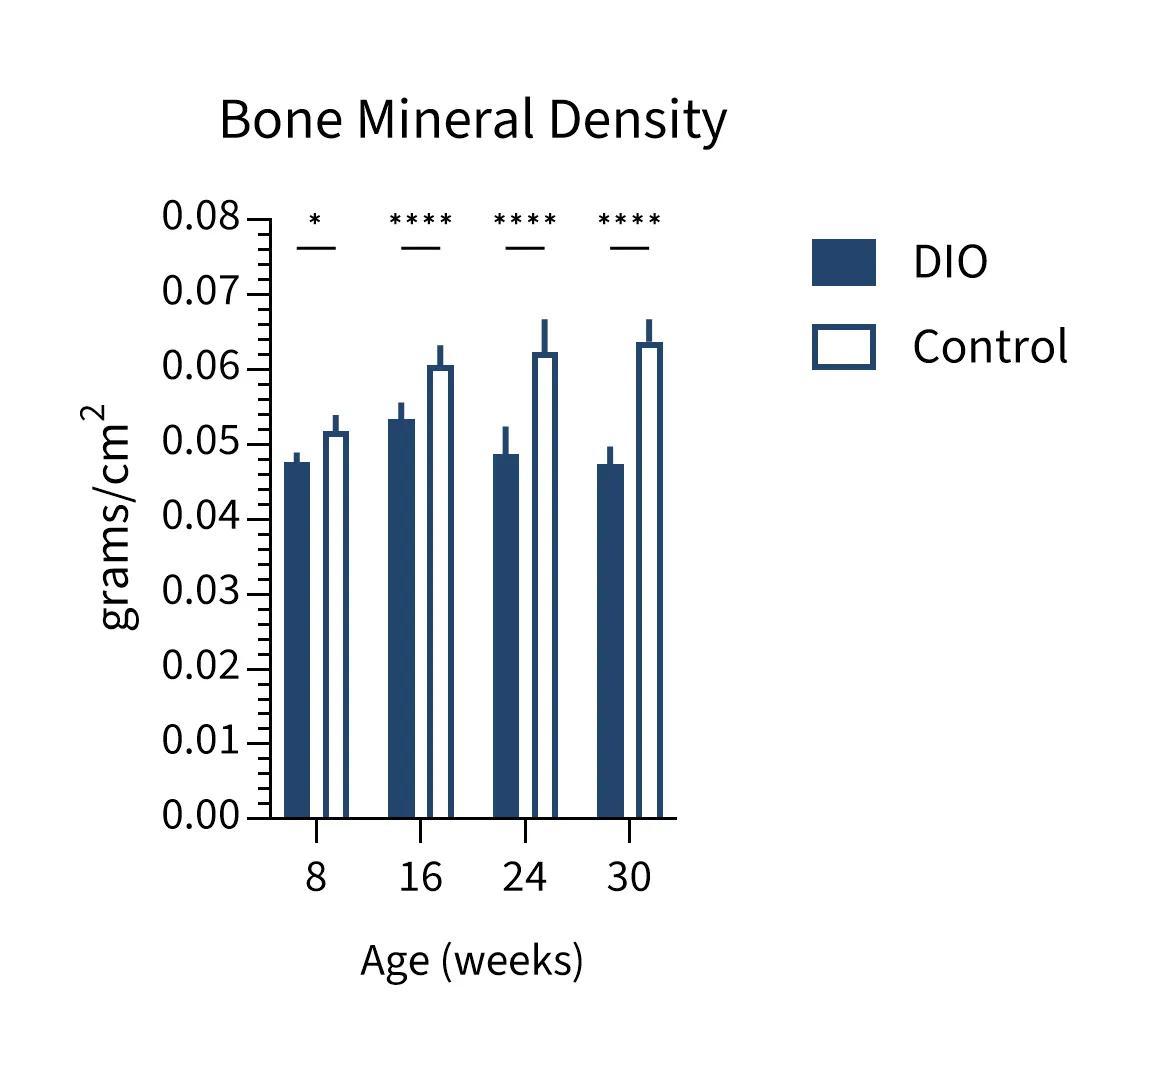
Figure 2 DEXA. Mice were weighed and then analyzed using an iNSiGHT DEXA. Calculations of body composition exclude the head. Values represent mean and one standard deviation of 10 DIO and 5 Control mice at each age. Results were analyzed using a 2-way ANOVA with Sidak multiple comparisons test (GraphPad Prism 10.5). * P < 0.05, *** P < 0.001; **** P < 0.0001.
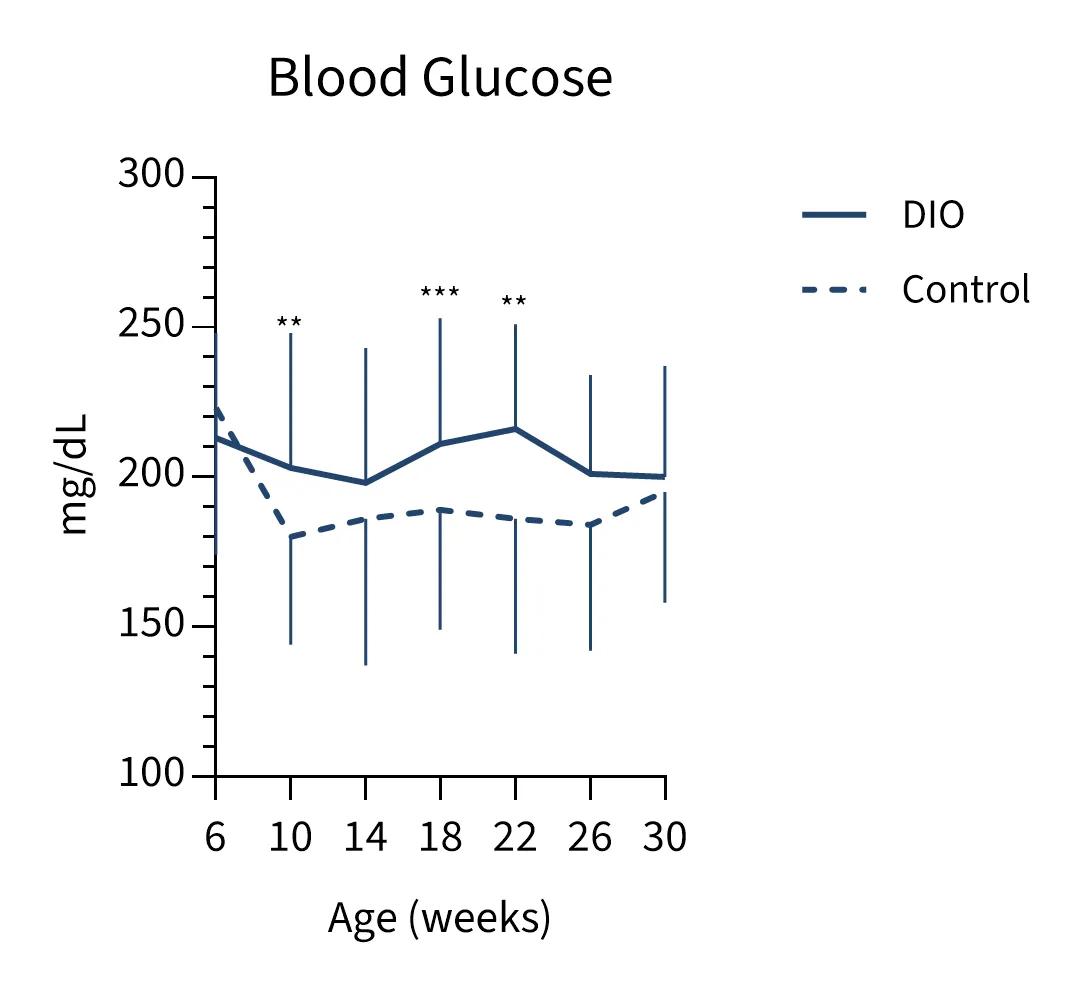
Figure 3 Non-fasted blood glucose. Monthly submental blood glucose measurements were obtained using a OneTouch Ultra 2 or UltraMini hand-held glucometer that was validated with a control glucose solution on each day of use. Values represent mean and one standard deviation of at least 90 DIO and 30 Control mice per age. When analyzed longitudinally using a repeated measures mixed-effects model with Sidak's multiple comparisons test, age, diet and a diet x age interaction were each significant (P < 0.001 for all; GraphPad Prism 10.5). ** P < 0.01; *** P < 0.001
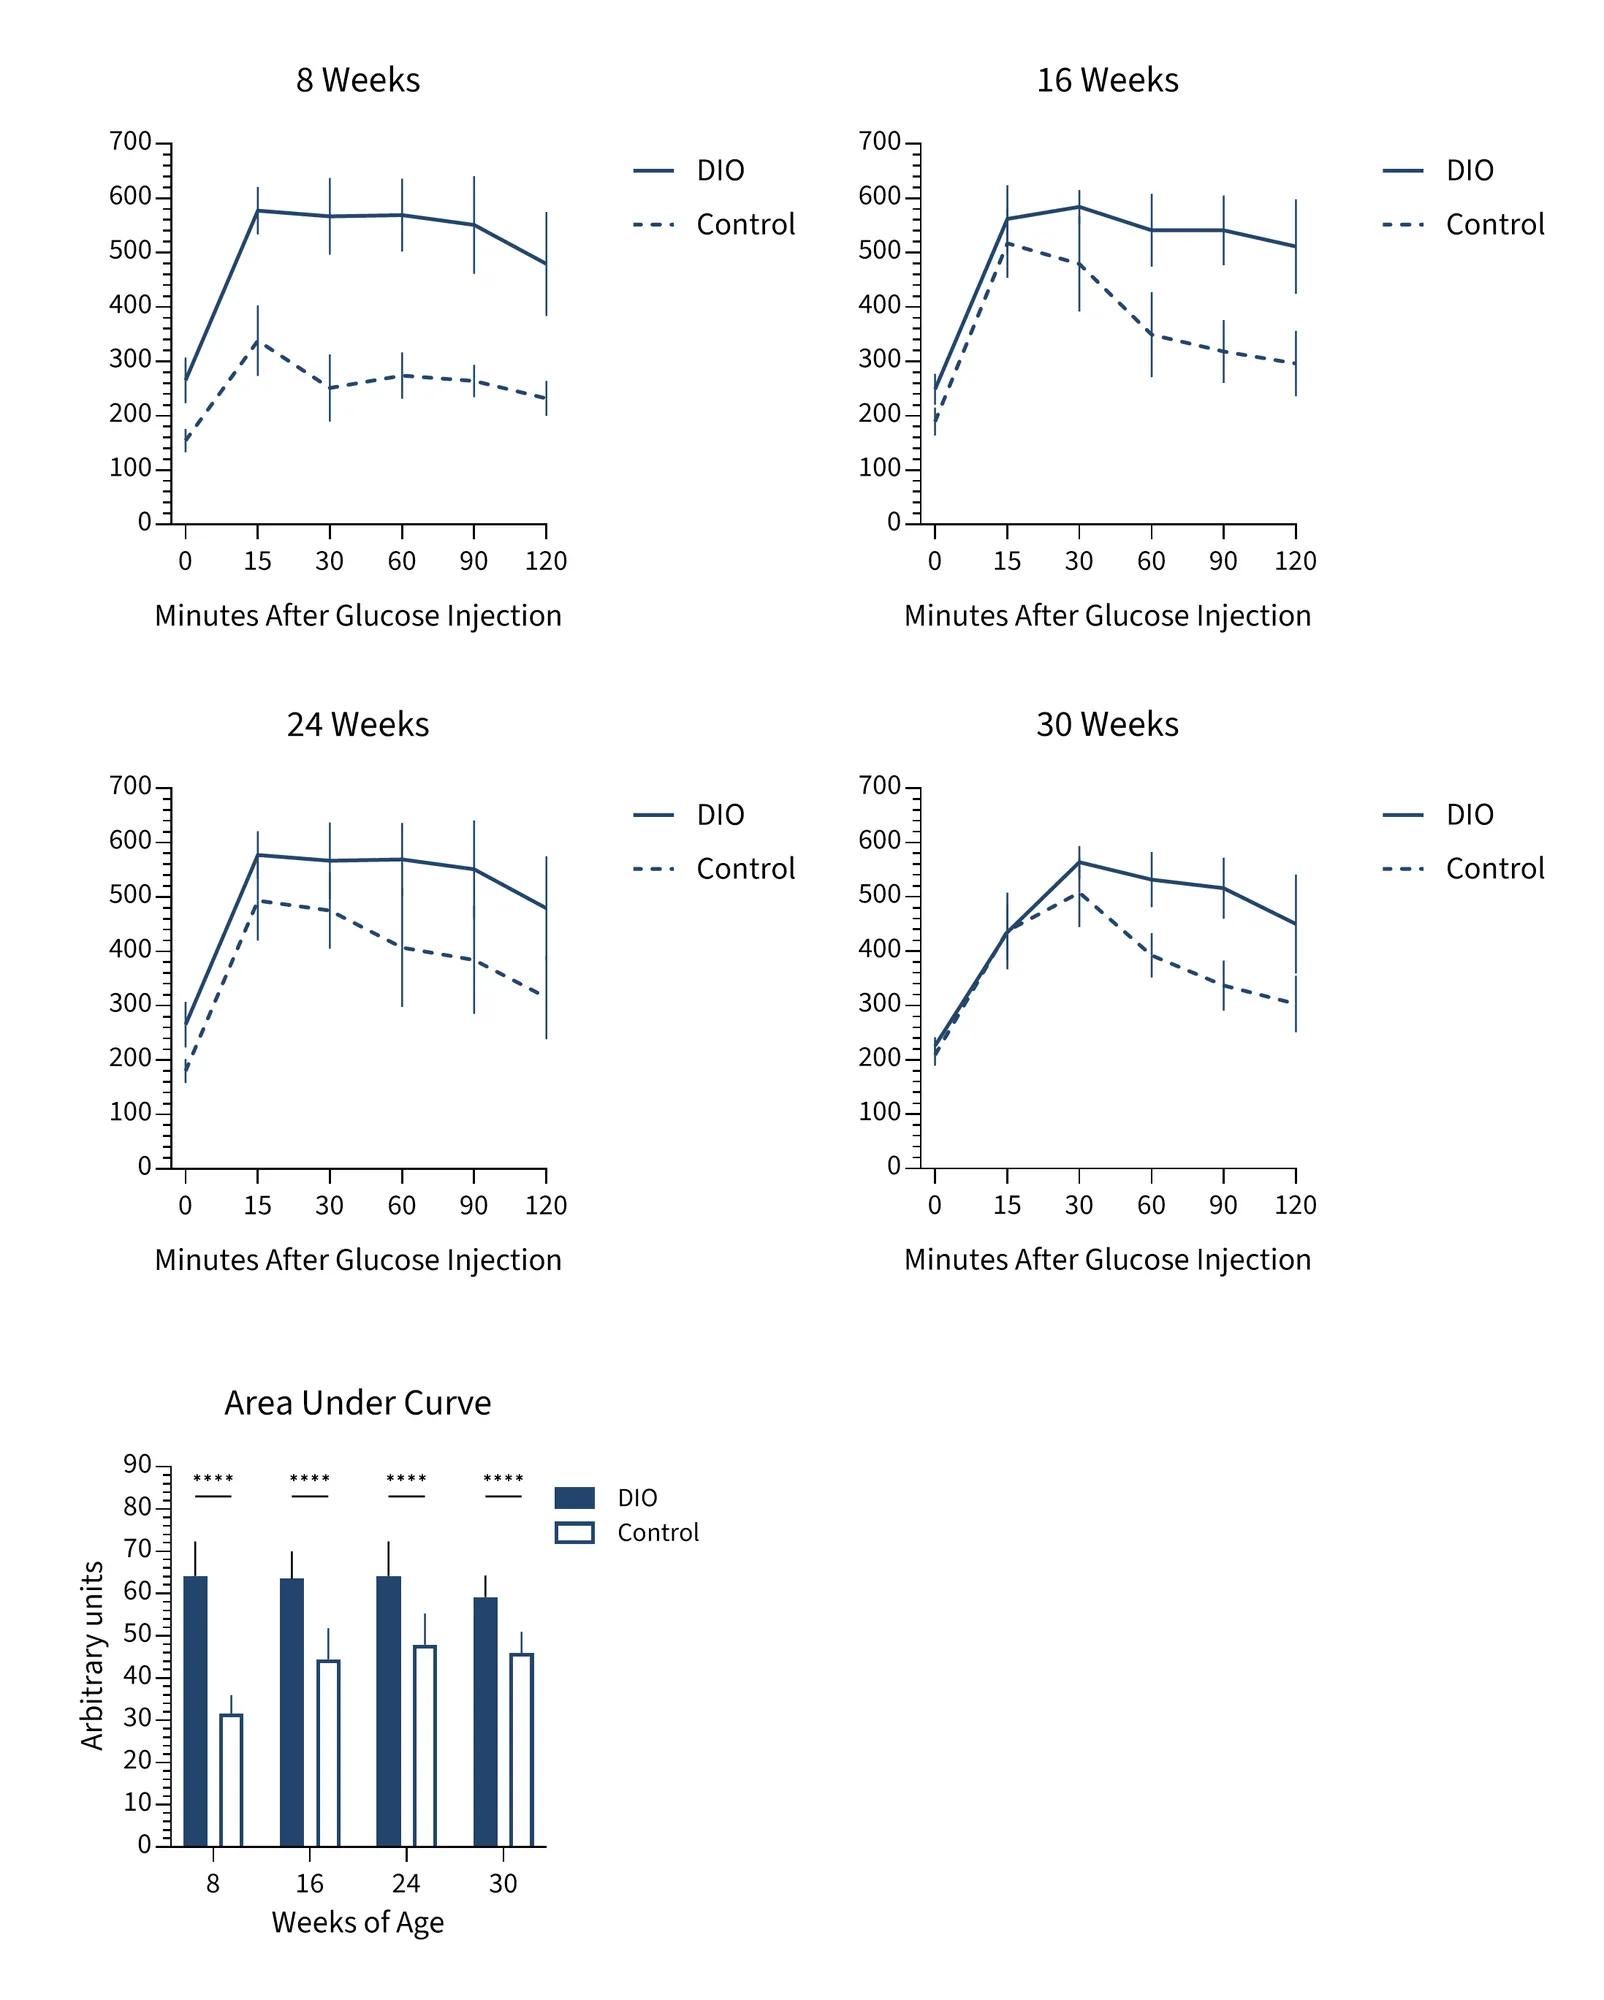
Figure 4 Glucose tolerance test. Following a 4 hour fast, a glucometer measurement was taken from submental blood for an initial glucose reading (0 minutes) and mice were then administered glucose by IP injection at 2g/kg body weight. Glucometer measurements were recorded at the indicated times. Values represent mean and one standard deviation of 20 mice per diet and time point. The area under the curve was calculated for each mouse and analyzed with 2-way ANOVA with Sidak's multiple comparisons test to determine if DIO and Control differed significantly at any age (GraphPad Prism 10.5). **** P < 0.0001.
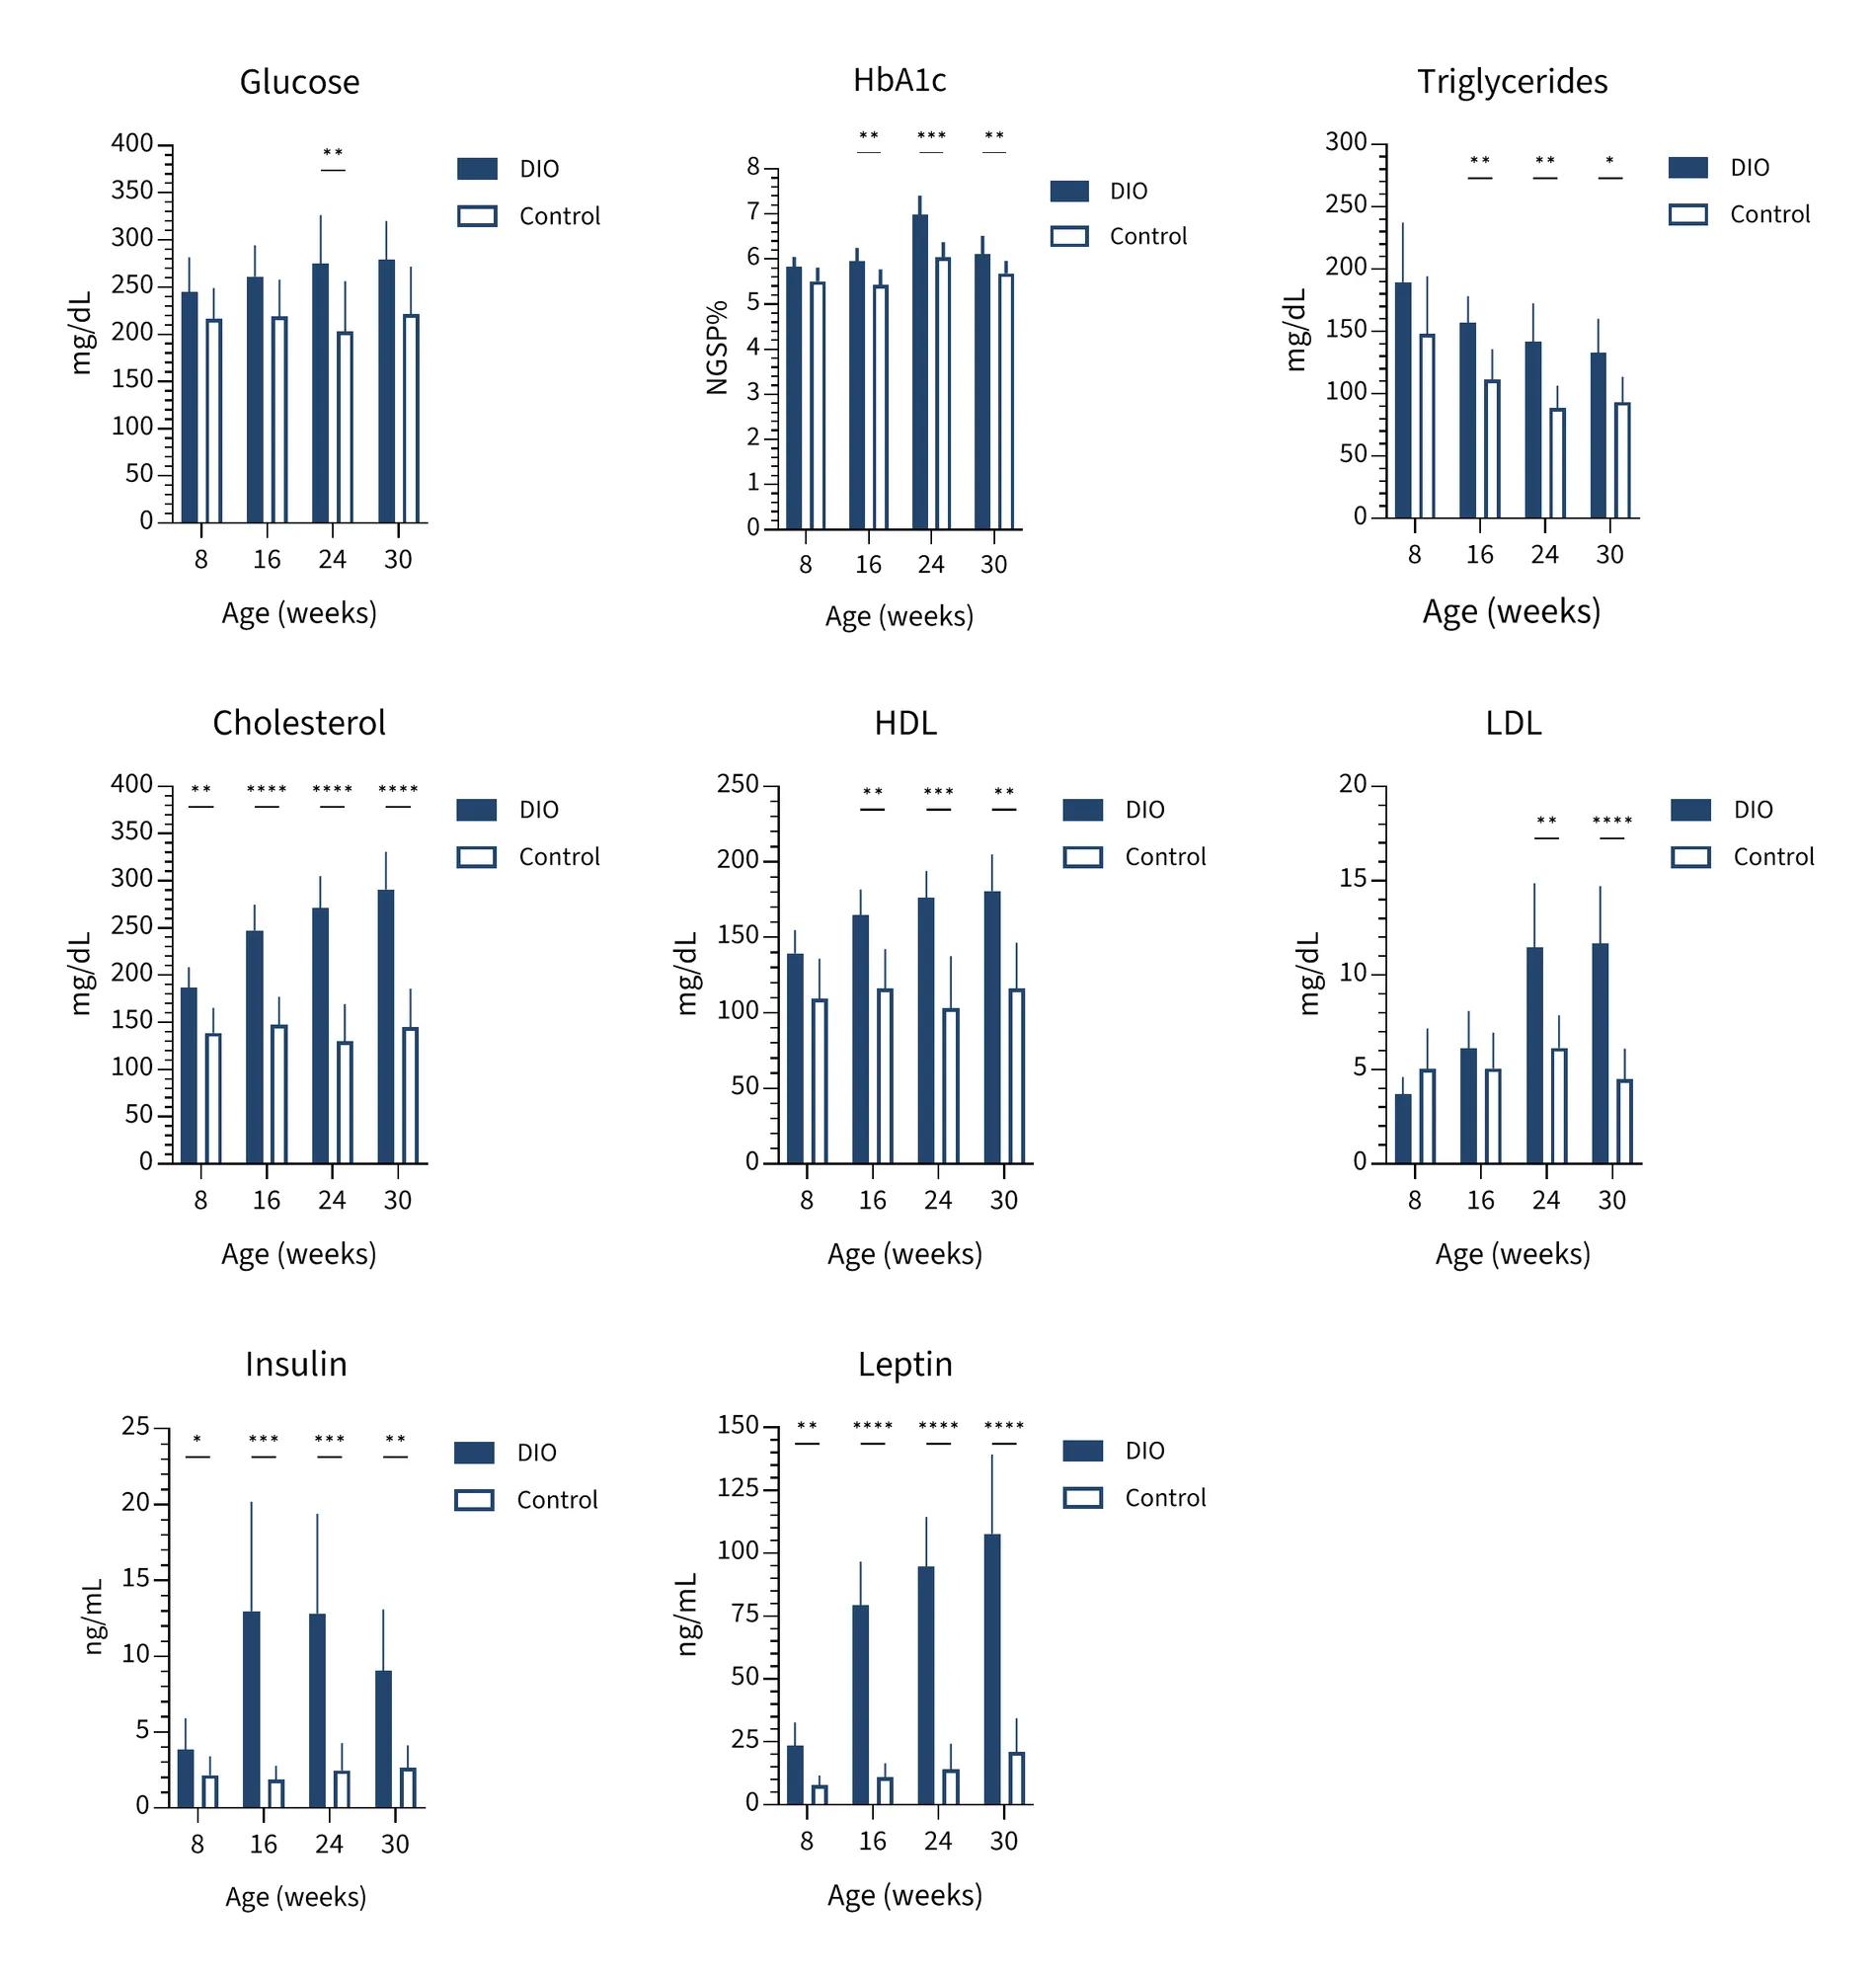
Figure 5 Serum chemistry and hormones. All values were measured from serum collected from submental blood except HbA1c, which was measured from submental whole blood. Values represent mean and one standard deviation of the same 20 non-fasted mice per age and diet group, studied longitudinally. Results were obtained using a Beckman Coulter DxC 700 AU chemistry analyzer or Meso Scale SQ120 analyzer (insulin & leptin). Results were analyzed separately by parameter using a repeated measures mixed-effects model with Sidak's multiple comparisons test. Significant differences between DIO and Control are indicated at each age;
* P < 0.05, ** P < 0.01, *** P < 0.001; **** P < 0.0001.