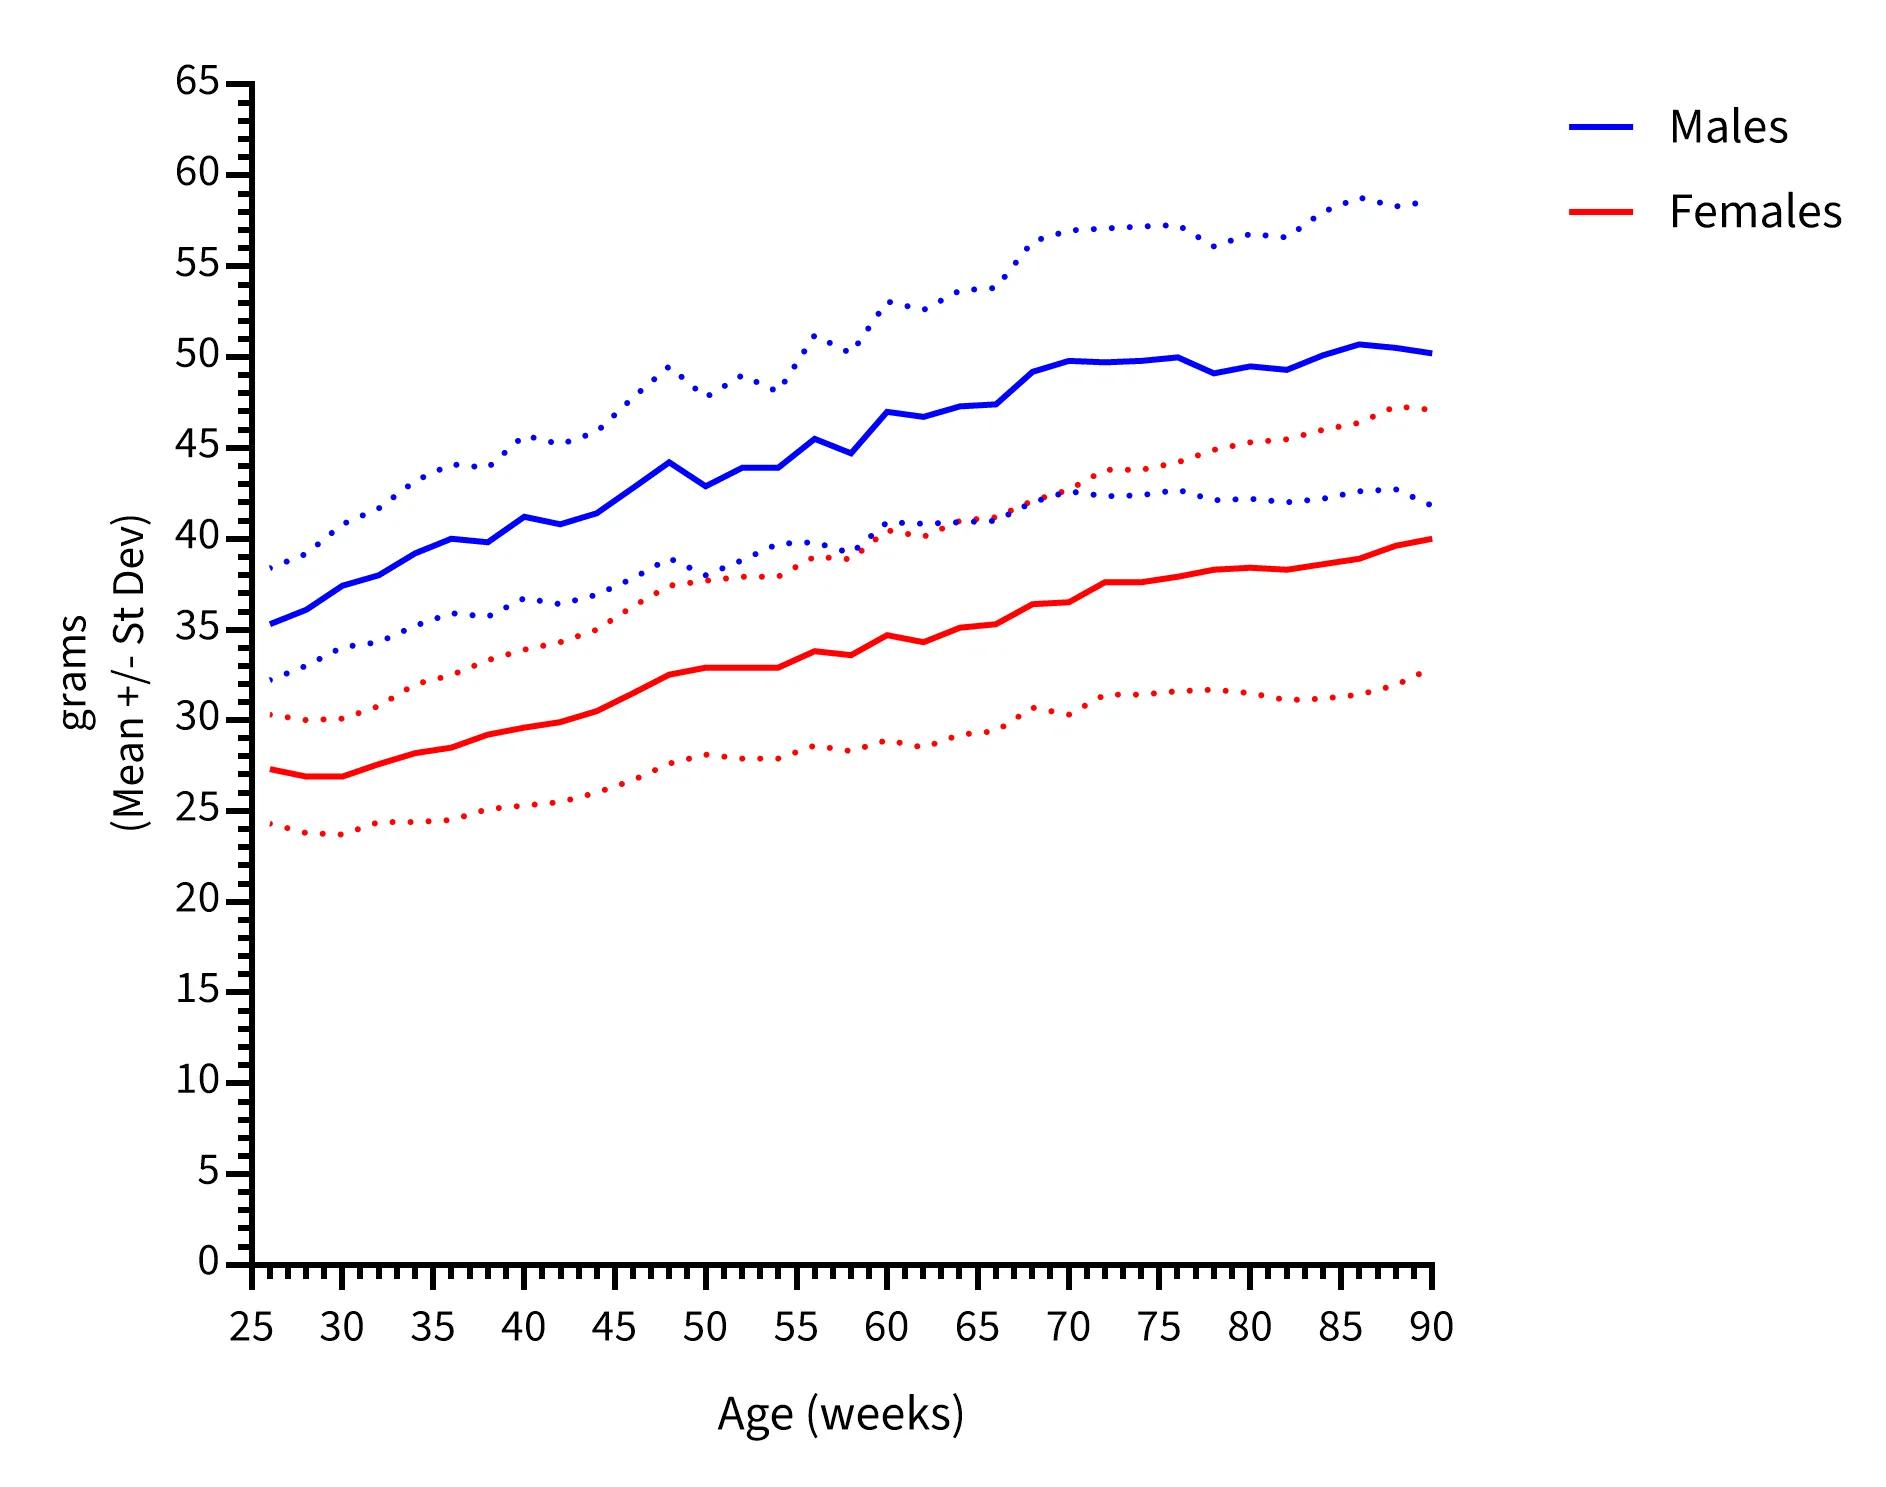
Females and males were weighed every two weeks. Mice were fed a diet containing 6% fat (LabDiet® 5K52 formulation). Values in the table below represent mean and one standard deviation (range in parentheses). Ages are ± 3 days. Group sizes began with 76 females and 80 males.
| Body Weight (grams; mean ± st. dev.) | |||||
|---|---|---|---|---|---|
| Age (weeks) | Females | Males | Age (weeks) | Females | Males |
| 26 | 27.3 ± 3.0 | 35.3 ± 3.1 | 60 | 34.7 ± 5.8 | 47.0 ± 6.1 |
| 28 | 26.9 ± 3.1 | 36.1 ± 3.1 | 62 | 34.3 ± 5.8 | 46.7 ± 5.9 |
| 30 | 26.9 ± 3.2 | 37.4 ± 3.4 | 64 | 35.1 ± 5.9 | 47.3 ± 6.4 |
| 32 | 27.6 ± 3.2 | 38.0 ± 3.7 | 66 | 35.3 ± 5.9 | 47.4 ± 6.4 |
| 34 | 28.2 ± 3.8 | 39.2 ± 4.0 | 68 | 36.4 ± 5.7 | 49.2 ± 7.2 |
| 36 | 28.5 ± 4.0 | 40.0 ± 4.1 | 70 | 36.5 ± 6.2 | 49.8 ± 7.2 |
| 38 | 29.2 ± 4.1 | 39.8 ± 4.1 | 72 | 37.6 ± 6.2 | 49.7 ± 7.4 |
| 40 | 29.6 ± 4.3 | 41.2 ± 4.5 | 74 | 37.6 ± 6.2 | 49.8 ± 7.4 |
| 42 | 29.9 ± 4.4 | 40.8 ± 4.4 | 76 | 37.9 ± 6.3 | 50.0 ± 7.3 |
| 44 | 30.5 ± 4.5 | 41.4 ± 4.5 | 78 | 38.3 ± 6.6 | 49.1 ± 7.0 |
| 46 | 31.5 ± 4.8 | 42.8 ± 5.0 | 80 | 38.4 ± 6.9 | 49.5 ± 7.3 |
| 48 | 32.5 ± 4.9 | 44.2 ± 5.3 | 82 | 38.3 ± 7.2 | 49.3 ± 7.3 |
| 50 | 32.9 ± 4.8 | 42.9 ± 4.9 | 84 | 38.6 ± 7.4 | 50.1 ± 7.9 |
| 52 | 32.9 ± 5.0 | 43.9 ± 5.1 | 86 | 38.9 ± 7.5 | 50.7 ± 8.1 |
| 54 | 32.9 ± 5.0 | 43.9 ± 4.2 | 88 | 39.6 ± 7.7 | 50.5 ± 7.8 |
| 56 | 33.8 ± 5.2 | 45.5 ± 5.7 | 90 | 40.0 ± 7.1 | 50.2 ± 8.4 |
| 58 | 33.6 ± 5.3 | 44.7 ± 5.5 | |||