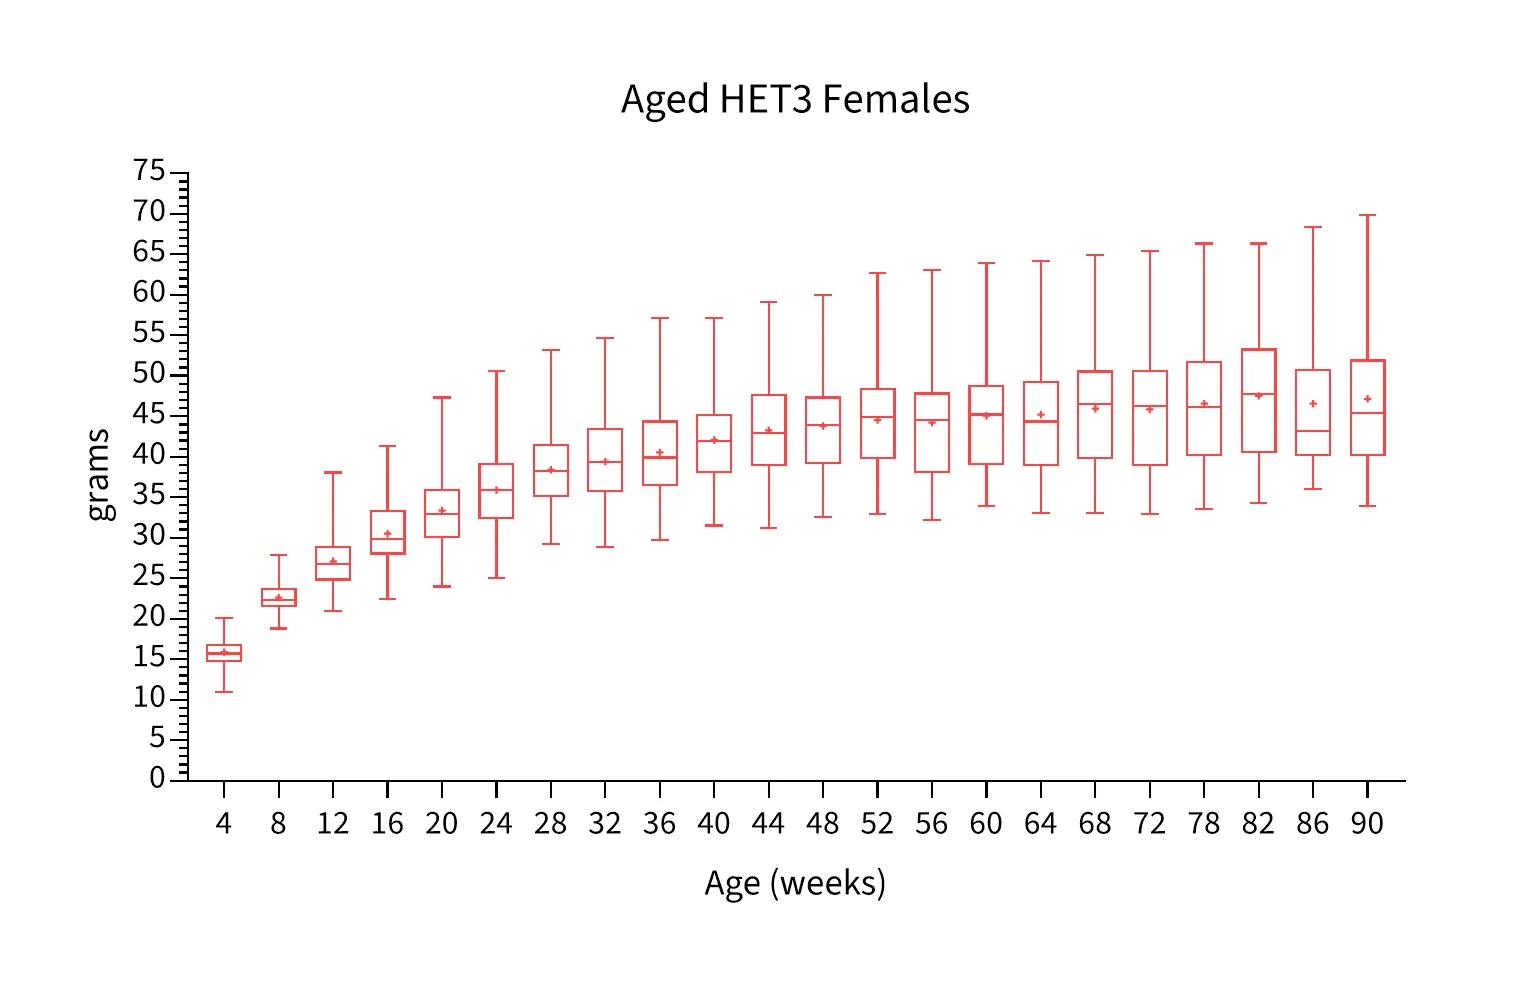
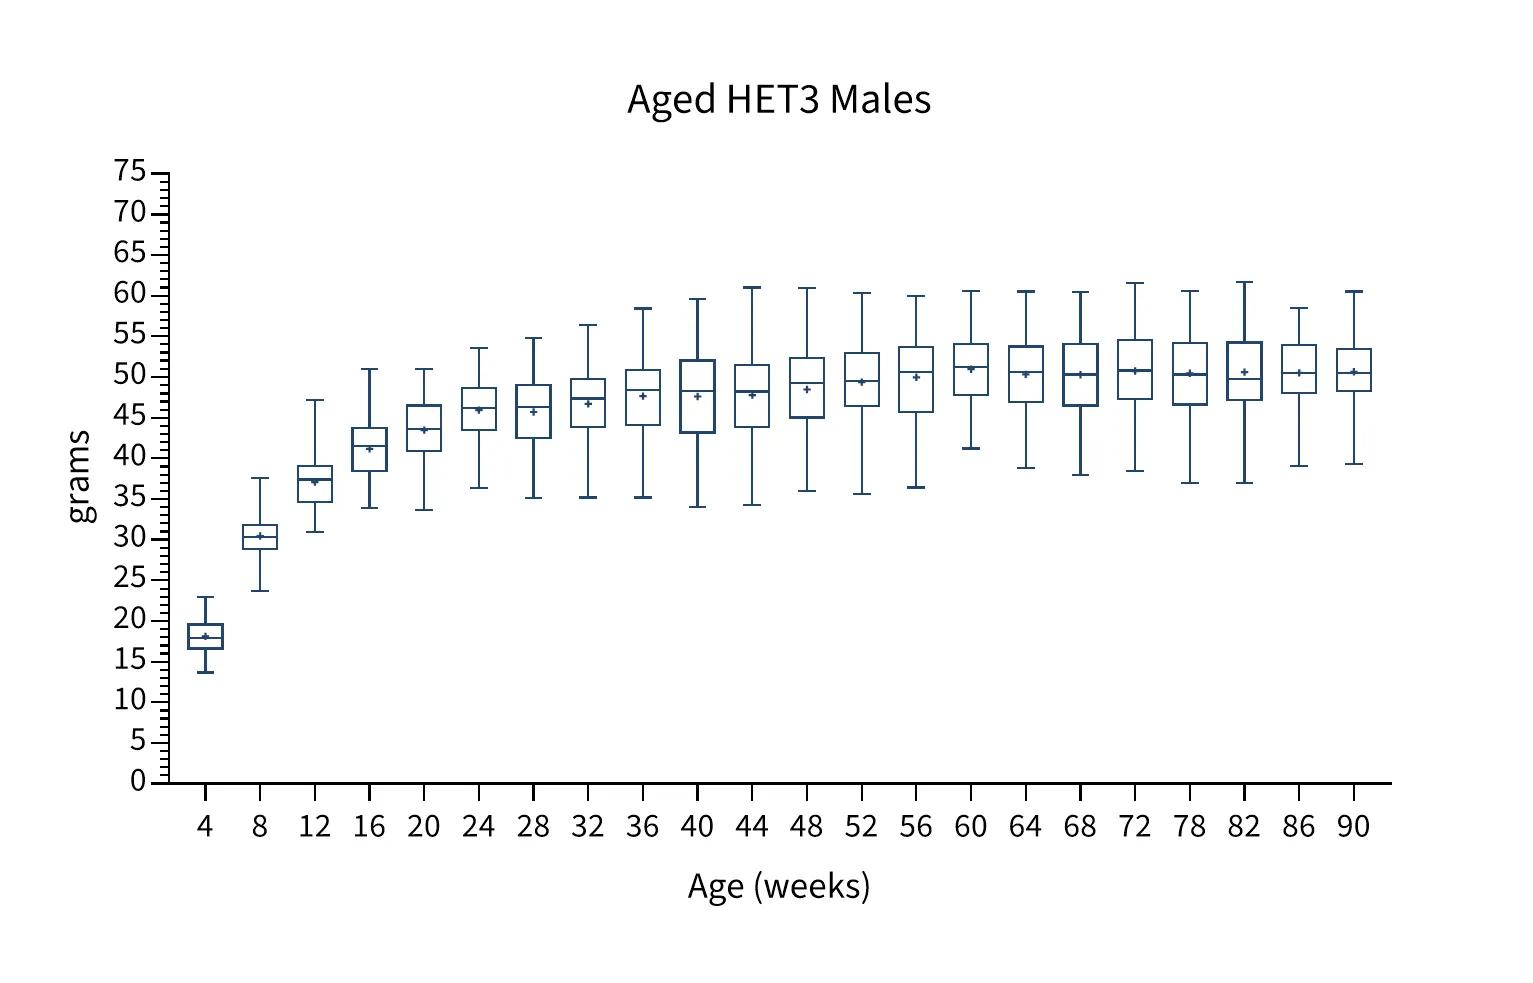
Groups that started with 150 males and 150 females were weighed weekly. Mice were fed a diet containing 6% fat (LabDiet® 5K52 formulation). The figure above shows monthly weights. Boxes extend from the 25th to 75th percentile. The horizontal line in each box shows the median weight and + shows the mean weight. Whiskers extend to maximum and minimum weights. The table below shows the mean and one standard deviation at even-numbered ages.
| Age (weeks) | Females | Males | Age (weeks) | Females | Males |
|---|---|---|---|---|---|
| 4 | 15.9 ± 1.7 | 18.1 ± 2.2 | 48 | 43.8 ± 5.9 | 48.5 ± 5.6 |
| 6 | 20.4 ± 1.5 | 26.1 ± 1.7 | 50 | 44.1 ± 6.4 | 48.5 ± 5.6 |
| 8 | 22.6 ± 1.7 | 30.5 ± 2.5 | 52 | 44.5 ± 6.3 | 49.4 ± 5.4 |
| 10 | 24.8 ± 2.4 | 34.3 ± 3.2 | 54 | 43.8 ± 6.6 | 50.2 ± 5.6 |
| 12 | 27.1 ± 3.1 | 37.1 ± 3.6 | 56 | 44.2 ± 6.9 | 50.0 ± 5.4 |
| 14 | 28.8 ± 3.4 | 39.1 ± 3.7 | 58 | 44.8 ± 7.1 | 49.9 ± 5.3 |
| 16 | 30.5 ± 3.8 | 41.2 ± 3.8 | 60 | 45.1 ± 7.4 | 51.0 ± 4.6 |
| 18 | 32.3 ± 4.2 | 42.5 ± 3.8 | 62 | 44.8 ± 7.6 | 50.9 ± 4.8 |
| 20 | 33.4 ± 4.4 | 43.5 ± 3.8 | 64 | 45.2 ± 7.6 | 50.3 ± 4.9 |
| 22 | 35.2 ± 4.8 | 44.4 ± 4.0 | 66 | 45.8 ± 7.6 | 50.3 ± 4.7 |
| 24 | 35.9 ± 5.3 | 45.9 ± 4.0 | 68 | 45.9 ± 7.8 | 50.3 ± 5.1 |
| 26 | 37.0 ± 5.1 | 45.4 ± 4.4 | 70 | 45.8 ± 7.8 | 50.9 ± 5.3 |
| 28 | 38.4 ± 5.1 | 45.7 ± 4.7 | 72 | 45.8 ± 8.3 | 50.8 ± 4.9 |
| 30 | 39.2 ± 5.3 | 46.4 ± 4.7 | 74 | 46.6 ± 8.3 | 50.5 ± 5.2 |
| 32 | 39.4 ± 5.3 | 46.7 ± 4.8 | 76 | 46.3 ± 8.7 | 51.9 ± 4.1 |
| 34 | 40.2 ± 5.4 | 47.3 ± 4.9 | 78 | 47.5 ± 8.5 | 50.6 ± 5.2 |
| 36 | 40.5 ± 5.6 | 47.6 ± 5.0 | 80 | 46.4 ± 8.8 | 50.7 ± 4.1 |
| 38 | 41.3 ± 5.6 | 47.4 ± 5.6 | 82 | 46.6 ± 8.8 | 50.5 ± 4.6 |
| 40 | 42.1 ± 5.5 | 47.6 ± 5.9 | 84 | 45.9 ± 9.8 | 50.9 ± 4.7 |
| 42 | 42.7 ± 5.5 | 48.1 ± 6.1 | 86 | 47.2 ± 9.5 | 50.7 ± 4.8 |
| 44 | 43.3 ± 5.8 | 47.8 ± 5.5 | 88 | 46.9 ± 9.7 | 50.4 ± 4.5 |
| 46 | 43.7 ± 5.8 | 48.1 ± 5.5 | 90 | 46.8 ± 9.5 | 50.0 ± 4.5 |