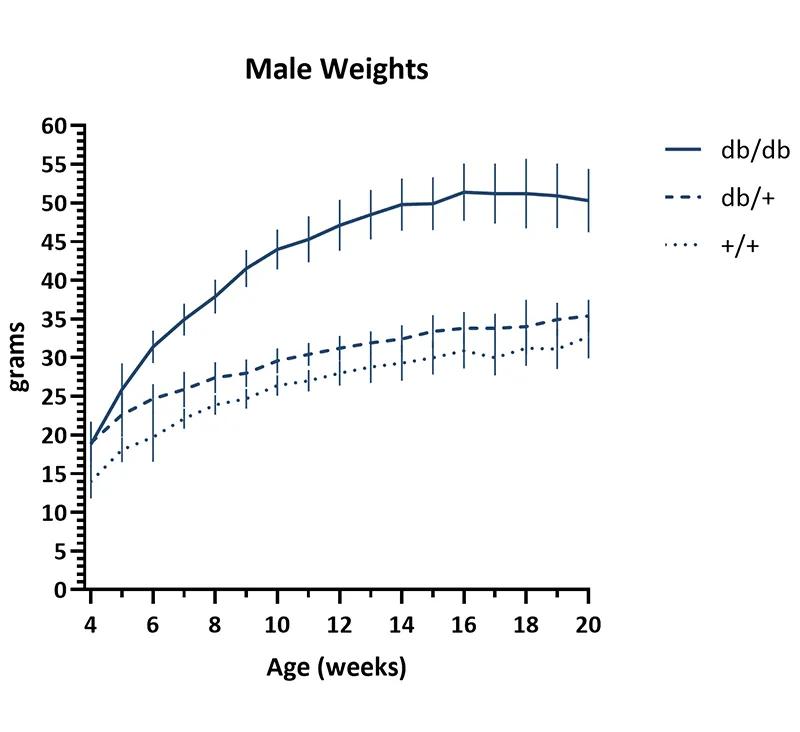
Weekly body weights of female (left) and male (right) mice. Cohorts included 60-70 db/db homozygous, 35 db/+ heterozygous, and 32-33 wildtype (+/+) mice per sex. Mice were fed a diet containing 6% fat (LabDiet® 5K52 formulation). Values represent mean and one standard deviation (grams).
| Body Weight (grams; mean ± st. dev.) | ||||||
|---|---|---|---|---|---|---|
| Females | Males | |||||
| Age (weeks) | db/db | db/+ | +/+ | db/db | db/+ | +/+ |
| 4 | 18.8 ± 3.4 | 16.2 ± 1.8 | 12.5 ± 2.6 | 18.8 ± 2.9 | 19.0 ± 2.5 | 14.0 ± 2.2 |
| 5 | 25.1 ± 4.1 | 18.9 ± 1.7 | 15.3 ± 2.2 | 25.9 ± 3.4 | 22.6 ± 2.9 | 18.1 ± 1.6 |
| 6 | 31.1 ± 2.5 | 19.9 ± 1.4 | 16.6 ± 1.4 | 31.4 ± 2.1 | 24.7 ± 1.9 | 19.7 ± 3.2 |
| 7 | 34.1 ± 2.8 | 21.0 ± 1.5 | 17.3 ± 1.7 | 34.9 ± 2.1 | 25.9 ± 2.3 | 22.1 ± 1.3 |
| 8 | 37.5 ± 3.0 | 22.5 ± 1.9 | 18.6 ± 1.5 | 37.9 ± 2.2 | 27.4 ± 2.0 | 23.9 ± 1.3 |
| 9 | 40.6 ± 2.6 | 22.9 ± 1.6 | 19.2 ± 1.4 | 41.5 ± 2.4 | 28.0 ± 1.8 | 24.7 ± 1.3 |
| 10 | 42.6 ± 2.6 | 24.4 ± 1.5 | 20.6 ± 1.8 | 44.0 ± 2.6 | 29.6 ± 1.6 | 26.4 ± 1.3 |
| 11 | 45.3 ± 2.8 | 24.9 ± 1.6 | 21.0 ± 1.7 | 45.3 ± 3.0 | 30.4 ± 1.5 | 27.0 ± 1.4 |
| 12 | 47.6 ± 2.9 | 25.7 ± 1.7 | 21.8 ± 2.2 | 47.1 ± 3.3 | 31.2 ± 1.6 | 28.0 ± 1.6 |
| 13 | 48.8 ± 3.0 | 26.9 ± 2.3 | 22.3 ± 2.3 | 48.5 ± 3.2 | 31.9 ± 1.5 | 28.8 ± 2.1 |
| 14 | 49.8 ± 3.0 | 26.8 ± 2.3 | 22.1 ± 2.1 | 49.8 ± 3.4 | 32.4 ± 1.8 | 29.3 ± 2.3 |
| 15 | 50.0 ± 3.5 | 27.3 ± 2.2 | 22.7 ± 2.4 | 49.9 ± 3.4 | 33.4 ± 2.1 | 30.0 ± 2.2 |
| 16 | 51.3 ± 3.6 | 27.3 ± 2.9 | 23.0 ± 2.3 | 51.4 ± 3.7 | 33.8 ± 2.1 | 30.9 ± 2.3 |
| 17 | 51.1 ± 3.6 | 27.3 ± 3.5 | 23.3 ± 2.8 | 51.2 ± 3.9 | 33.8 ± 1.9 | 30.0 ± 2.3 |
| 18 | 51.2 ± 4.0 | 27.5 ± 2.6 | 23.0 ± 2.4 | 51.2 ± 4.5 | 34.0 ± 3.5 | 31.2 ± 2.3 |
| 19 | 51.5 ± 4.3 | 28.4 ± 3.0 | 24.2 ± 2.7 | 50.9 ± 4.2 | 34.9 ± 2.2 | 31.1 ± 2.6 |
| 20 | 48.9 ± 4.4 | 29.2 ± 3.2 | 25.4 ± 2.7 | 50.3 ± 4.1 | 35.4 ± 2.1 | 32.7 ± 2.8 |