Type 2 diabetes phenotypes in female and male C57BL/6J leptin mutant mice (B6-ob; B6.Cg-Lepob/J) include:
Homozygous ob/ob mice are fed LabDiet 5K20 (10% fat w/w) and heterozygous ob/+ mice are fed LabDiet 5K52 formulation (6% fat w/w).

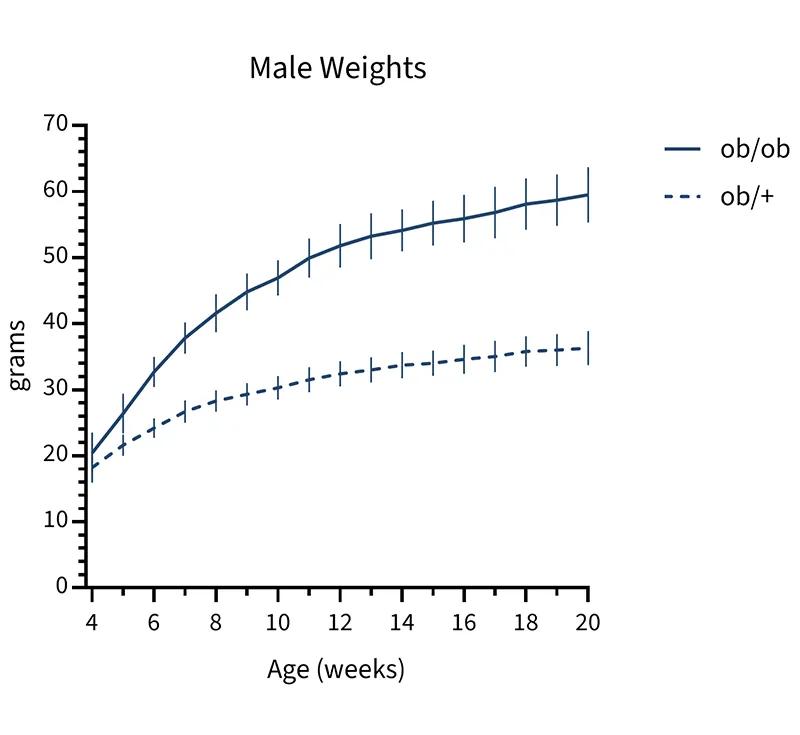
Figure 1 Body weight growth curve. Weekly weights of female and male mice between the ages of 4 and 20 weeks. Values represent the mean and one standard deviation. Cohorts began with 75 homozygous and 50 heterozygous mice per sex. Weights are also available in tabular form.
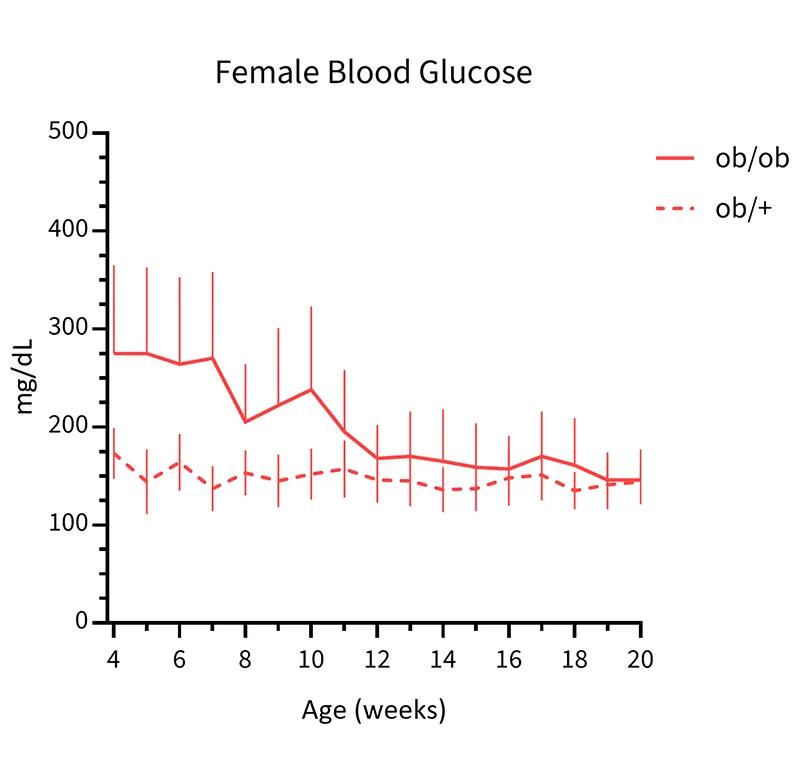

Figure 2 Non-fasted blood glucose. Weekly submental blood glucose measurements were obtained from the same cohorts described in Figure 1 using a OneTouch Ultra 2 or UltraMini hand-held glucometer that was validated with a control glucose solution on each day of use. Values represent mean and one standard deviation.
Table 1 Distribution of blood glucose. The glucose values used to create Figure 2 were grouped into ranges by age and sex (F= female, M=male).
| Glucose Range (mg/dL) | 4 weeks | 6 weeks | 8 weeks | 10 weeks | 12 weeks | 14 weeks | 16 weeks | 18 weeks | 20 weeks | |||||||||
|---|---|---|---|---|---|---|---|---|---|---|---|---|---|---|---|---|---|---|
| F | M | F | M | F | M | F | M | F | M | F | M | F | M | F | M | F | M | |
| < 250 | 46% | 57% | 55% | 42% | 78% | 42% | 62% | 57% | 96% | 75% | 93% | 84% | 100% | 93% | 97% | 90% | 100% | 97% |
| 250 — 399 | 39% | 36% | 36% | 38% | 23% | 31% | 33% | 32% | 4% | 19% | 7% | 15% | 0% | 5% | 2% | 10% | 0% | 3% |
| 400 — 499 | 15% | 7% | 7% | 19% | 0% | 27% | 5% | 11% | 0% | 6% | 0% | 1% | 0% | 2% | 2% | 0% | 0% | 0% |
| > 600 | 0% | 0% | 1% | 1% | 0% | 0% | 0% | 0% | 0% | 0% | 0% | 0% | 0% | 0% | 0% | 0% | 0% | 0% |

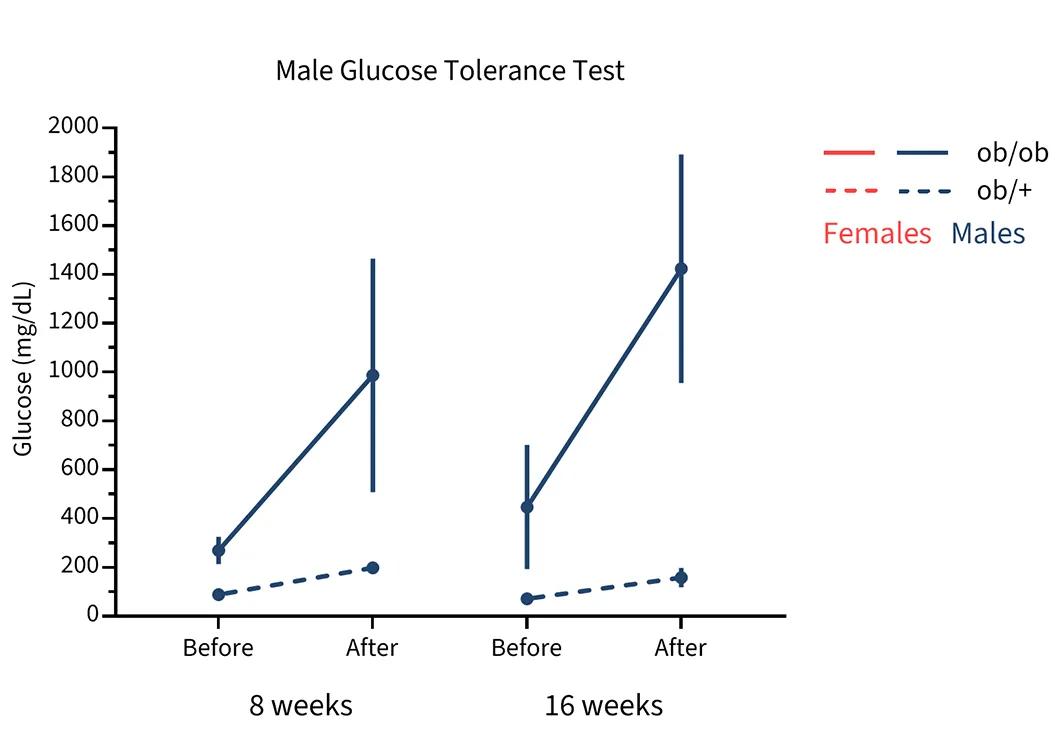
Figure 3 Glucose tolerance. Following a 16 hour fast, serum was collected from submental blood for an initial glucose reading (“Before”) and mice were then administered glucose by IP injection at 2g/kg body weight. Serum glucose was measured after 120 minutes (“After”). Values represent mean and one standard deviation of 10-15 mice per genotype and age. Glucose was measured with a Beckman Coulter DxC 700 AU chemistry analyzer.
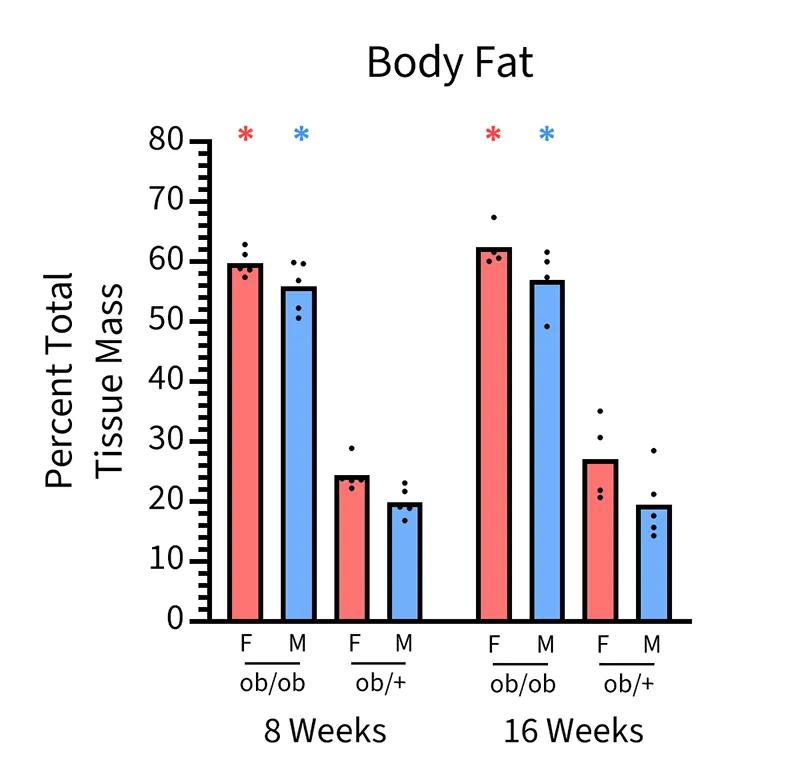
Figure 4 Body Composition. Mice were analyzed using a Lunar PIXImus DEXA scanner. Calculations of body composition exclude the head. Values represent mean and one standard deviation; N=4-5 per sex, genotype, and age. Results were analyzed using two-way ANOVA with Sidak's multiple comparisons test using GraphPad Prism version 10.0 for Windows (GraphPad Software) to identify significant differences among groups. An * indicates a significant difference between same-sex ob/ob and ob/+ values at that age (P < 0.0001).
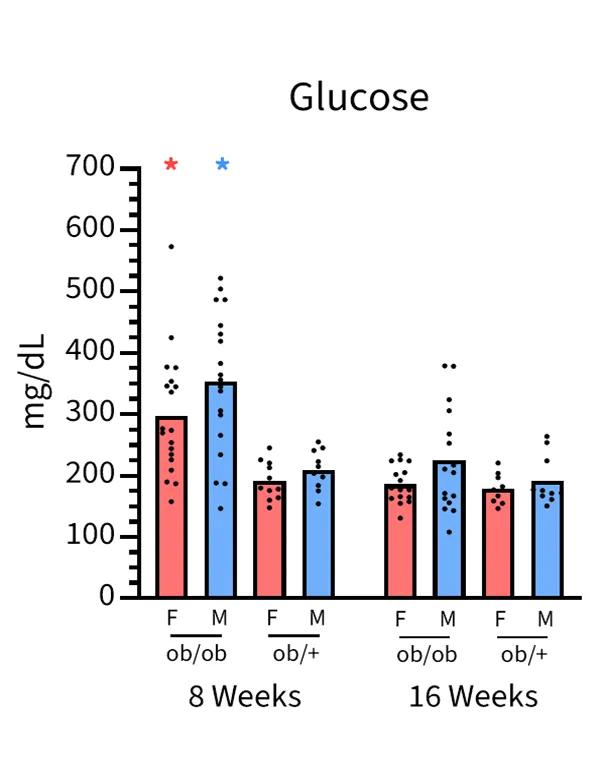


Figure 5 Serum chemistry and hormones. All values were measured from serum collected from submental blood except HbA1c, which was measured from submental whole blood. Bars represent the average of up to 20 non-fasted ob/ob mice and 10 ob/+ mice per age, studied longitudinally. Results were obtained using a Beckman Coulter DxC 700 AU chemistry analyzer or Meso Scale SQ120 analyzer (insulin & leptin). Results were analyzed separately by parameter using a repeated measures mixed-effects model with Sidak's multiple comparisons test. An * indicates that the ob/ob result was significantly different from the same-sex ob/+ result at that age (P < 0.05).