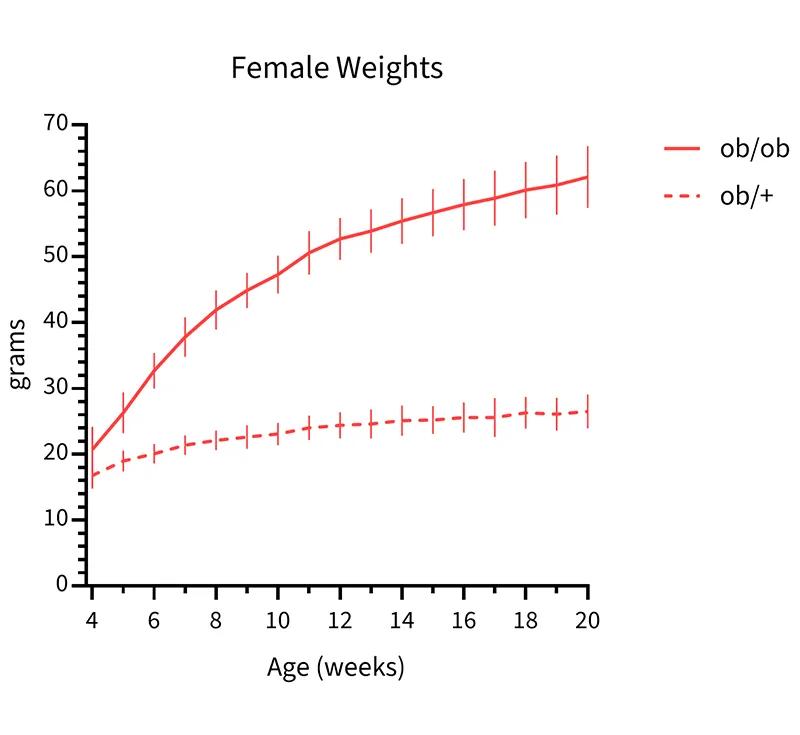
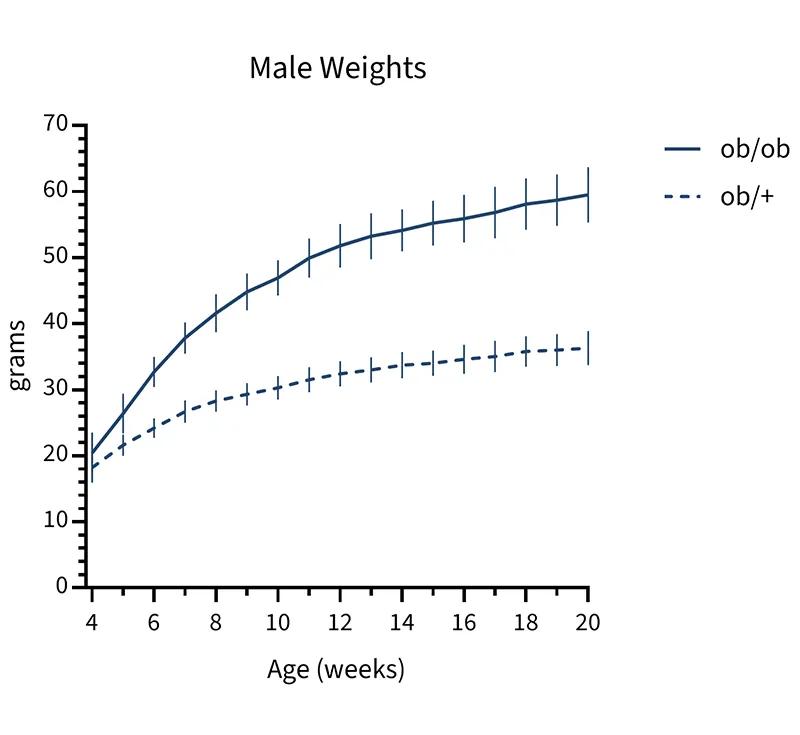
Weekly weights of female and male mice between the ages of 4 and 20 weeks. Values represent the mean and one standard deviation. Cohorts began with 75 homozygous (ob/ob) and 50 heterozygous (ob/+) mice per sex. The ob/ob genotype was fed a diet containing 10% fat (LabDiet® 5K20); ob/+ was fed a 6% fat diet (LabDiet® 5K52 formulation). Ages are ± 3 days.
| Body Weight (grams; mean ± st. dev.) | ||||
|---|---|---|---|---|
| ob/ob genotype | ob/+ genotype | |||
| Age (weeks) | Females | Males | Females | Males |
| 4 | 20.7 ± 3.5 | 20.4 ± 3.1 | 16.8 ± 2.0 | 18.2 ± 2.3 |
| 5 | 26.3 ± 3.1 | 26.4 ± 3.0 | 19.0 ± 1.6 | 21.6 ± 1.6 |
| 6 | 32.7 ± 2.7 | 32.7 ± 2.3 | 20.1 ± 1.5 | 24.2 ± 1.5 |
| 7 | 37.8 ± 3.0 | 37.8 ± 2.4 | 21.4 ± 1.5 | 26.7 ± 1.7 |
| 8 | 41.9 ± 3.0 | 41.6 ± 2.9 | 22.1 ± 1.5 | 28.3 ± 1.6 |
| 9 | 44.9 ± 2.7 | 44.8 ± 2.8 | 22.6 ± 1.8 | 29.3 ± 1.7 |
| 10 | 47.3 ± 2.9 | 46.9 ± 2.7 | 23.1 ± 1.7 | 30.3 ± 1.8 |
| 11 | 50.6 ± 3.3 | 49.9 ± 3.0 | 24.0 ± 1.9 | 31.5 ± 1.9 |
| 12 | 52.7 ± 3.2 | 51.8 ± 3.3 | 24.4 ± 2.0 | 32.4 ± 1.9 |
| 13 | 53.9 ± 3.3 | 53.2 ± 3.5 | 24.6 ± 2.2 | 33.0 ± 1.9 |
| 14 | 55.4 ± 3.5 | 54.1 ± 3.2 | 25.1 ± 2.3 | 33.7 ± 2.0 |
| 15 | 56.7 ± 3.6 | 55.2 ± 3.4 | 25.2 ± 2.1 | 34.0 ± 1.9 |
| 16 | 57.9 ± 3.9 | 55.9 ± 3.6 | 25.6 ± 2.3 | 34.6 ± 2.2 |
| 17 | 58.9 ± 4.2 | 56.8 ± 3.9 | 25.6 ± 3.0 | 35.0 ± 2.4 |
| 18 | 60.1 ± 4.3 | 58.1 ± 3.9 | 26.3 ± 2.4 | 35.8 ± 2.3 |
| 19 | 60.9 ± 4.5 | 58.7 ± 3.9 | 26.1 ± 2.5 | 36.0 ± 2.4 |
| 20 | 62.1 ± 4.7 | 59.5 ± 4.2 | 26.5 ± 2.6 | 36.3 ± 2.6 |