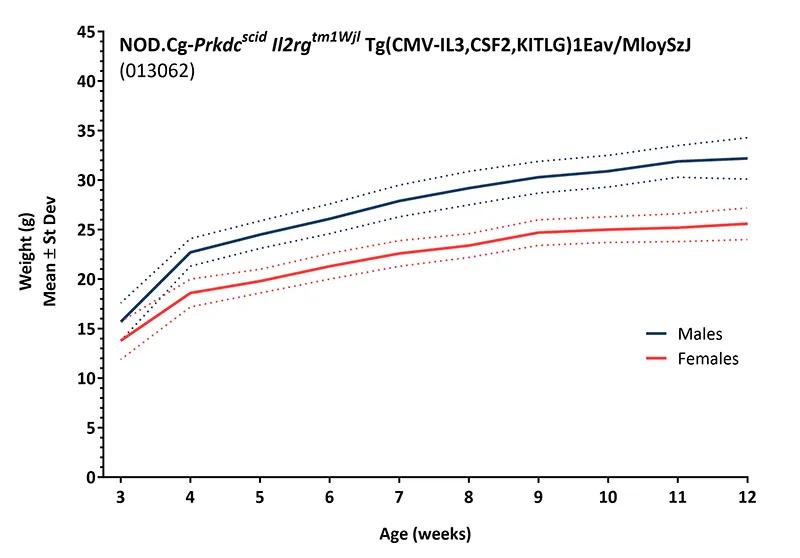
Groups of 30 females and 30 males were weighed weekly. Mice were fed a diet containing 6% fat (LabDiet® 5K52 formulation). Values represent mean and one standard deviation. Ages are ± 3 days.
| Body Weight (grams; mean ± st. dev.) | ||
|---|---|---|
| Age (weeks) | Females | Males |
| 3 | 13.8 ± 1.9 | 15.7 ± 1.9 |
| 4 | 18.6 ± 1.4 | 22.0 ± 3.9 |
| 5 | 19.8 ± 1.2 | 24.5 ± 1.4 |
| 6 | 21.3 ± 1.3 | 26.1 ± 1.5 |
| 7 | 22.6 ± 1.3 | 27.9 ± 1.6 |
| 8 | 23.4 ± 1.2 | 29.2 ± 1.7 |
| 9 | 24.7 ± 1.3 | 30.3 ± 1.6 |
| 10 | 25.0 ± 1.3 | 30.9 ± 1.6 |
| 11 | 25.2 ± 1.4 | 31.9 ± 1.6 |
| 12 | 25.6 ± 1.6 | 32.2 ± 2.1 |