glue: Making sense of the universe in three dimensions
Featured Article | April 5, 2022
Right now, 1.5 million kilometers away, a marvel of engineering is stabilizing and deploying its various technologies. The James Webb Space Telescope (JWST), launched on Christmas Eve 2021, will delve deep into the universe—as much as 13.6 billion light years away, soon after the Big Bang—and reveal far more than what is currently known.
Right now, 0 kilometers away, a marvel of biology is present within all of us. Our genomes, 3.2 billion base pairs of orchestrated coding and regulation, are the centerpieces of cellular function and the myriad molecular processes involved. Researchers are delving far beyond the linear sequences of our genomes to reveal what underlies health and disease.
What connects the farthest reaches of the universe and our own internal universes? In the case of The Jackson Laboratory (JAX), it is the aptly named glue solutions inc., a firm specializing in data science and visualization. glue solutions, led by Harvard astronomy professor Alyssa Goodman, Ph.D., grew out of a project to visualize astronomy data, including facilitating data analysis and visualization for the JWST. Now it is working with JAX to do the same for genomics, providing ways to bring the data to life through visual representations.
What is data visualization?
Examples of basic data visualization are all around us. A topographic map that shows elevation lines that make it easy to pick out mountains and follow river valleys is one. The kind of infographic thatUSA Today made famous is another, allowing readers to quickly see what the numbers in an article—be they different dollar amounts, employment numbers over time, relative sizes of objects, or whatever—actually represent. And anyone clicking on the graphing tool in an Excel spreadsheet is working with data visualization on their own computer.
Handling (big data) demands expertise, robust tools and a lot of computational horsepower. And without visualization, the data can be difficult or impossible for even experts to work with.
So-called big data, with data sets containing millions of data points or more, also benefits from data visualization to better comprehend its signals and communicate them to others. But handling this amount of data—imagine 32 billion rows (just 10 genomes) in an Excel file!— demands expertise, robust tools and a lot of computational horsepower. And without visualization, the data can be difficult or impossible for even experts to work with. Astronomy provides an excellent example, as the data acquired is rarely in the form of the spectacular visible light images of galaxies and nebulas we marvel at. It is a vast array of signals from different directions in different wavelengths and energy levels, all of which must be assembled, analyzed and represented visually in order to “see” the features of the universe around us.
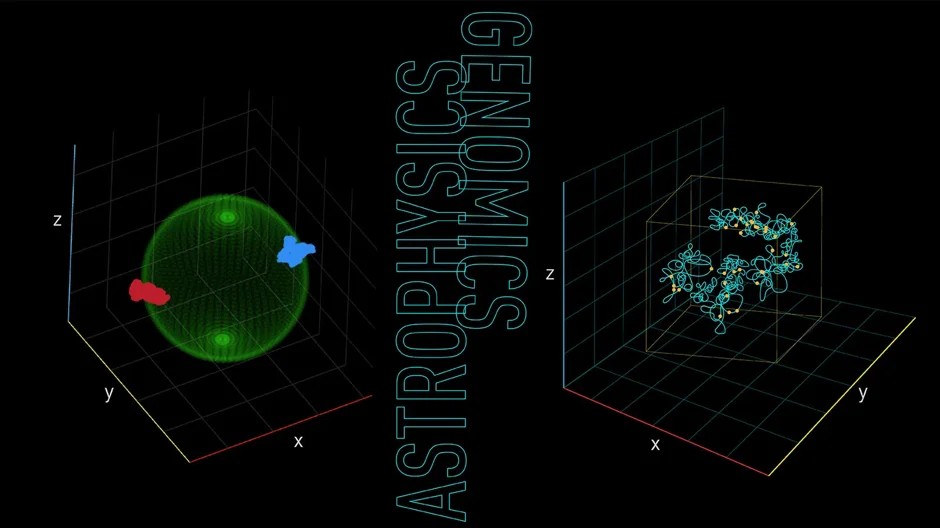
From molecular clouds to molecular bases
glue has already had a significant impact on astronomy data visualization. Using data from Gaia, the European Space Agency’s space-based telescope and star mapping mission, astronomers have been studying two molecular clouds, Perseus and Taurus. In astronomical terms, the clouds are relatively near to earth—as close as 400 (Taurus) and as far as 1,300 (Perseus) light years away—and have been well-studied in two dimensions. Using glue-powered visualization and augmented reality, however, researchers mapped them in three dimensions for the first time last year. Thenew 3D map revealed that, while separated in space, they are both on the surface of a huge sphere-shaped void, a “superbubble” in interstellar space. The visualizations have provided valuable new insight into how the clouds formed (likely from the same supernova shockwave), their relative densities, and the dynamics of star formation within the clouds.
The story of Perseus and Taurus, or PerTau for short, is the sort of thing that the glue software package was initially developed to do. That said, it was also designed from the ground up to be an open source, multi-disciplinary tool. When launching the project in the late 2000s, Goodman and colleagues sought to make it applicable to a wide variety of data types.
“We developed the predecessor to what is now glue based on medical imaging software used for surgery planning in three dimensions,” says Goodman. “We saw the potential for 3D medical software in combination with exploratory data analysis in astronomy and other fields using high-dimensional data, and others agreed. Back in 2012, we were offered unexpected JWST funding based on apaper, only half-written at the time, designed to explain what glue ‘could’ do—even before the software was really ready for widespread use.”
We saw the potential for 3D medical software in combination with exploratory data analysis in astronomy and other fields using high-dimensional data, and others agreed.
The glue project has grown rapidly since, and its open source code is being used for many different purposes. In fact, the situation became unwieldy—“fun projects, but too many requests,” Goodman notes—so the team launched glue solutions, inc. to work with commercial partners. Though for-profit, glue solutions gives away half of its proceeds to support the open source software community.
glue is now being applied to genomics at JAX through a suite of tools called “glue genes,” making visualizations possible for the endless streams of bases (A T G C) and biological complexity to reveal patterns and insight otherwise hidden in the data.
“In astronomy, our high-resolution images often come with a third dimension, creating so-called ‘image cubes,’” says Goodman. “In biology, high-resolution 3D data, preserving information about where gene sequences come from, spatially, within a sample, is about to be available. Looking toward the future, in a discussion a couple of years ago, [former JAX President and CEO] Ed Liu and I talked about how high-resolution ‘spatial transcriptomics’ would soon be possible, and that original conversation has led to glue genes. Today, glue genes connects a wide variety of data and plot types—including 3D views of tangled-up DNA inside a nucleus—allowing scientists to explore a wide variety of information within the context of a graphical interface. Soon, the augmented reality functionality glue offers astronomers will also come to glue genes.”
Genomics revealed
Data visualization for genomics data is nothing new. Genome browsers, which make analyzing linear sequences much easier, are important tools for annotating genome sequences. For example, where are known protein binding sites, or where are epigenetic marks (chemical compounds that change function without changing the sequence) located on the sequence? Another common tool is a heatmap, which uses different colors and color intensities to represent relative levels or magnitudes in the data. Heatmaps can be used for a variety of applications, but in biology they are usually used to represent the levels of gene expression for different genes across a variety of samples. There are also circos plots, the often highly complex circular diagrams that can show various types of genomic data at specific locations, as well as the interactions between them.
Visualizing genomes in three dimensions provides the opportunity for new insights that linear sequences simply don’t provide
But genomics is moving beyond linear sequences. The chromosomes themselves function in three dimensions, and sequences that may be far apart on a linear basis can frequently interact, either directly or indirectly, in ways that are important for gene expression, regulation and function. Therefore, visualizing genomes in three dimensions provides the opportunity for new insights that linear sequences simply don’t provide, similar to PerTau and its place in the Milky Way. And different types of data—transcriptomics (all the RNA transcripts in a cell or tissue), proteomics (the proteins found in cells and tissues), metabolomics and more—need to be layered with genomics data to reveal how the coding affects function. glue and JAX are therefore working to leverage the capabilities of glue in an entirely new way.
“One of the great limitations we see in the biological sciences is the ability to link, integrate, explore and visualize different types of highly complex genomics data generated from different technology platforms,” says Chief of Presidential Initiatives Madeleine Braun, Ph.D., who is coordinating the collaboration at JAX. “Together with Dr. Alyssa Goodman and her team, we’re adapting glue solutions’ tools to address this urgent need, making it easier to bridge, stack up and cross-analyze diverse types of data to find new insights.”
Visualizing faint signals
JAX’s work with glue comes at a time when JAX researchers are facing some of the most difficult challenges in biological research head on. An important example is a study into type 2 diabetes (T2D), a disease that involves a collision of genetic, environmental and behavioral factors. Even as T2D has become an increasing worldwide health problem, researchers and clinicians have been stymied in their search to understand the genetic signals that show whether people are more or less susceptible to the disease, especially when combined with risk factors such as western diets and a sedentary lifestyle. A team at JAX is working to merge the signals found in human studies, which have identified hundreds of genomic locations associated with T2D, with research using genetically diverse mice.
“The type 2 diabetes study has been a significant scientific and operational effort for the Lab,” says JAX Principal Scientific Software Engineer Jake Emerson, M.S. “We’re working to develop an effective interface between human and mouse data across the research program, and to make the data readily accessible for all researchers at JAX. glue genes is an exciting part of that effort, providing intuitive data visualization up front as well as the ability to extend the toolkit for specialized inquiries moving forward.”
glue genes (provides) intuitive data visualization up front as well as the ability to extend the toolkit for specialized inquiries moving forward.
Emerson notes that working with biological data can be similar to assembling an astronomical image, integrating a collection of data types to reveal the full picture. In biology, that proceeds from the genetic code to the messages transcribed (which can be processed in different ways) to the proteins produced, covering the full arc of function. Ultimately, the molecular data can be merged with the measurable physical and physiological traits that result and show how, in disease, function is disrupted.
So, as the JWST starts its work and helps scientists understand the universe around us, even billions of light years away, glue technology will play an equally important role in helping JAX researchers understand our own internal universes with precision and high resolution. The first step is to apply the lessons learned in the T2D pilot to other research areas, such as cancer, Alzheimer’s disease, autoimmune disease and other difficult-to-treat diseases and conditions. The ultimate goal? It may seem distant now, but a future with better health and less disease may be closer than you think.