Male and female BTBR mice with the ob leptin mutation (BTBR-ob; BTBR.Cg-Lepob/WiscJ) develop type 2 diabetes with kidney complications. Phenotypes include:
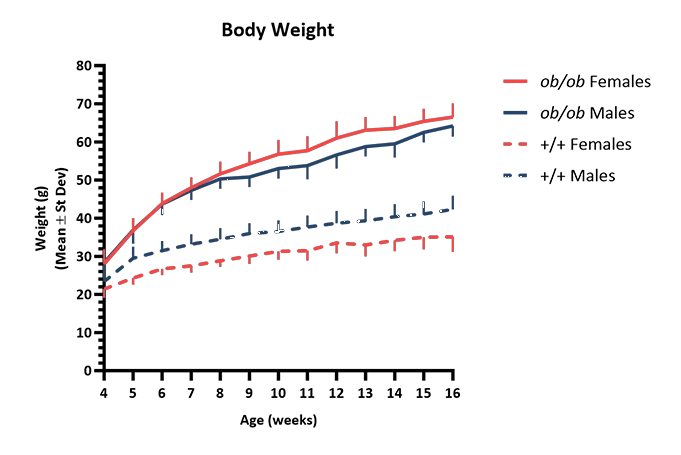
Figure 1 Body weight growth curve. Left figure: Weekly body weights of male and female mice. Cohorts included 38-40 ob/ob homozygotes and 30 wildtype (+/+) mice per sex. Mice were fed a diet containing 6% fat (LabDiet® 5K52 formulation). Values represent mean and one standard deviation. Right figure: body composition. Mice were analyzed using a Lunar PIXImus DEXA scanner. Calculations of body composition exclude the head. Values represent mean and one standard deviation of 3-5 mice per sex, genotype, and age. Results were analyzed by age and sex using two-way ANOVA with Sidak's multiple comparisons test to identify values that differed significantly between genotypes, using GraphPad Prism version 10.0 for Windows (GraphPad Software). There was no difference in adiposity between male and female ob/ob mice at either age. Body fat in ob/ob males and females was higher than sex-matched wildtype mice at both ages (P < 0.0001 for all).
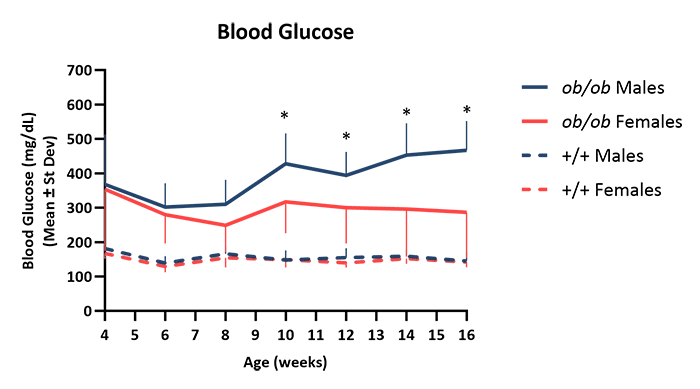
Figure 2 Nonfasted glucose. Blood glucose levels in male and female mice were measured every other week. Submental blood glucose measurements were obtained from the same cohorts described in Figure 1 using a OneTouch Ultra 2 glucometer that was validated with a control glucose solution on each day of use. Values represent mean and one standard deviation. When analyzed longitudinally using a repeated measures mixed-effects model with Sidak's multiple comparisons test, age, genotype, and an age x genotype interaction were each significant at P < 0.0001 (GraphPad Prism 10). A * indicates a significant difference between male and female ob/ob mice at a given age (P < 0.05). Glucose in ob/ob males and females were higher than sex-matched wildtype mice at every age (P < 0.05).
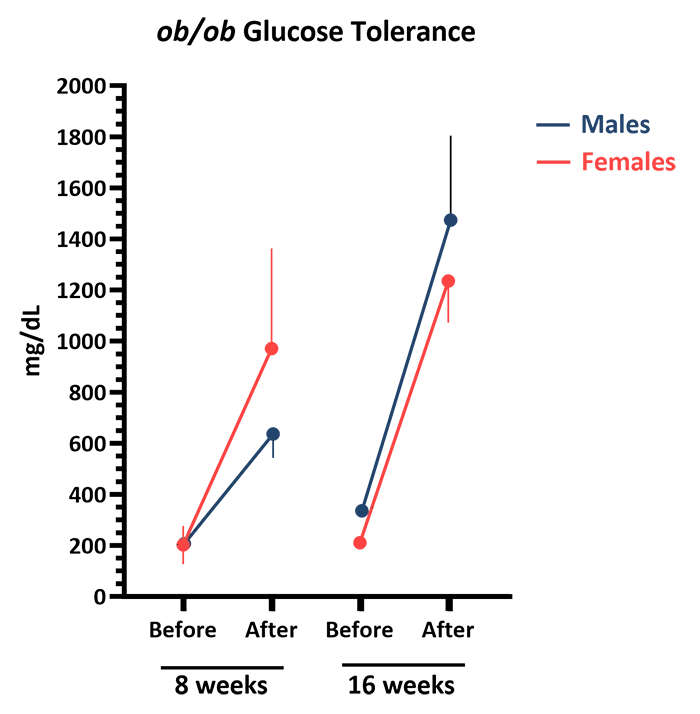
Figure 3 Glucose tolerance test. Following a 16 hour fast, serum was collected from submental blood for an initial glucose reading (“Before”) and mice were then administered glucose by IP injection at 2g/kg body weight. Serum glucose was measured after 120 minutes (“After”). Glucose was measured using a Beckman Coulter DxC 700 AU chemistry analyzer. Values represent mean and one standard deviation of 4-5 mice per age and sex.

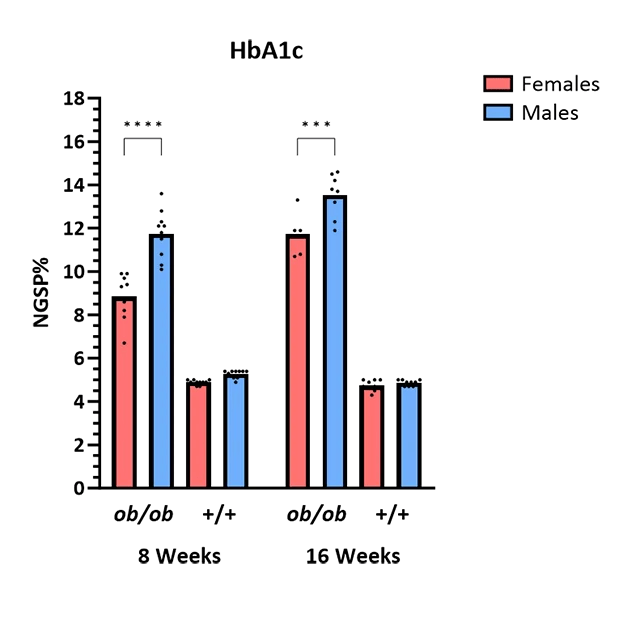


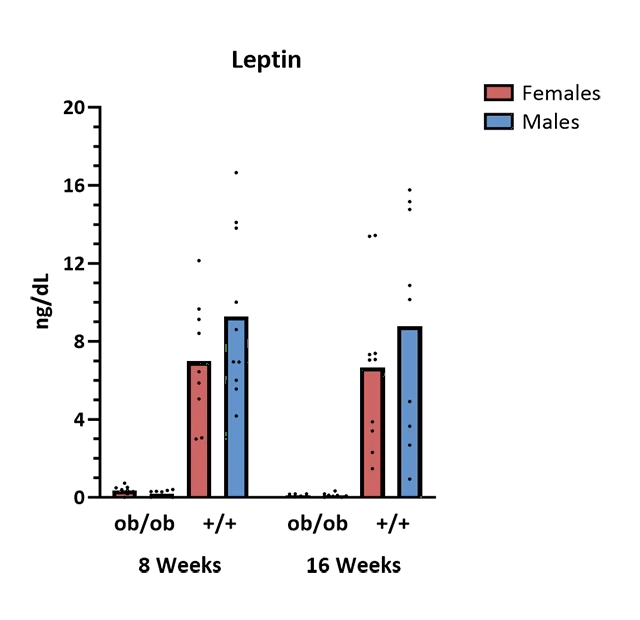
Figure 4 Serum chemistry and hormones. All values were measured from serum collected from submental blood except HbA1c, which was measured from submental whole blood. Bar graph heights represent means of the same 5-10 non-fasted mice per age and sex, studied longitudinally. Results were obtained using a Beckman Coulter DxC 700 AU chemistry analyzer or Meso Scale SQ120 analyzer (insulin & leptin). Results were analyzed separately by parameter using a repeated measures mixed-effects model with Sidak's multiple comparisons test. Only differences between male and female ob/ob mice are shown; ** P < 0.01, **** P < 0.0001.
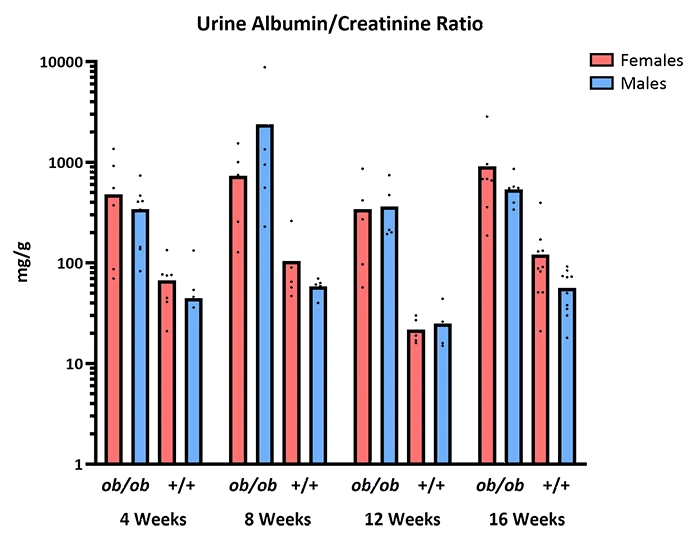
Figure 5 Urinalysis. Urine was collected from 5-10 mice per genotype and sex at the indicated ages and analyzed using a Beckman Coulter DxC 700 AU chemistry analyzer.